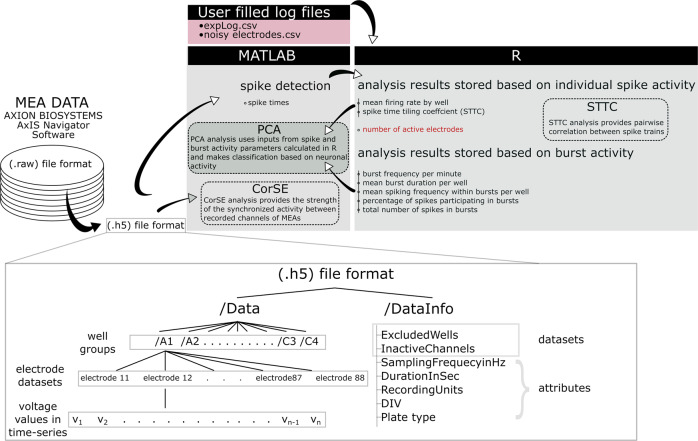
Fig. 2.
Preparation and analysis of the data. The raw data recorded with AxIS Navigator software were reformatted in HDF5 format (.h5) to include both the raw data and associated metadata. The architecture of .h5 is also presented. Spike detection was performed in MATLAB, and the spike times were saved for further analysis. Burst detection was performed in R from the previously calculated spike times. The parameters based on spike and burst activity were calculated in R, and the results were stored in .csv format. The stored parameters were used as inputs to principal component analysis (PCA) for data classification (except the number of active electrodes, which was only used for calculating some other parameters). Network synchronization was estimated from the raw data by correlated spectral entropy (CorSE) analysis in MATLAB, and the spike time tiling coefficient (STTC)-based pairwise correlation was calculated from the spike times in R.

