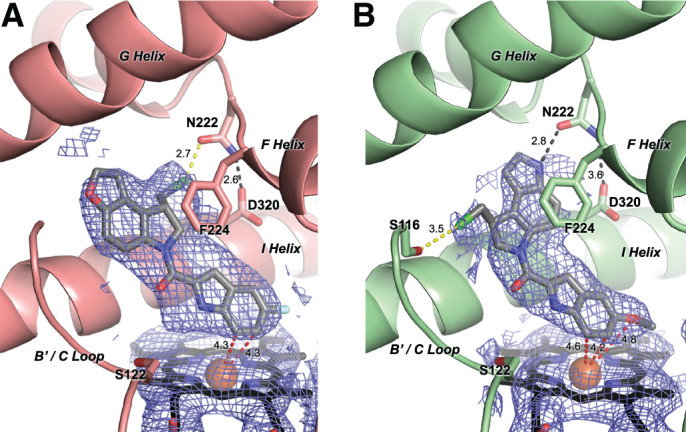
Fig. 5.

Co-crystallization structures of CYP1A1 (ribbons) bound to (S)-ICT2726 (A) and (S)-ICT2700 (B) (gray sticks). Electron density is shown as 2Fo – Fc composite omit map contoured at 1.0 σ (blue mesh) around the ligand and heme (black sticks with orange Fe sphere). Potential hydrogen bonds (black dashes), halogen bonds (yellow dashes), and ligand atoms in closest proximity to the heme iron (red dashes) are shown with their corresponding distances.
