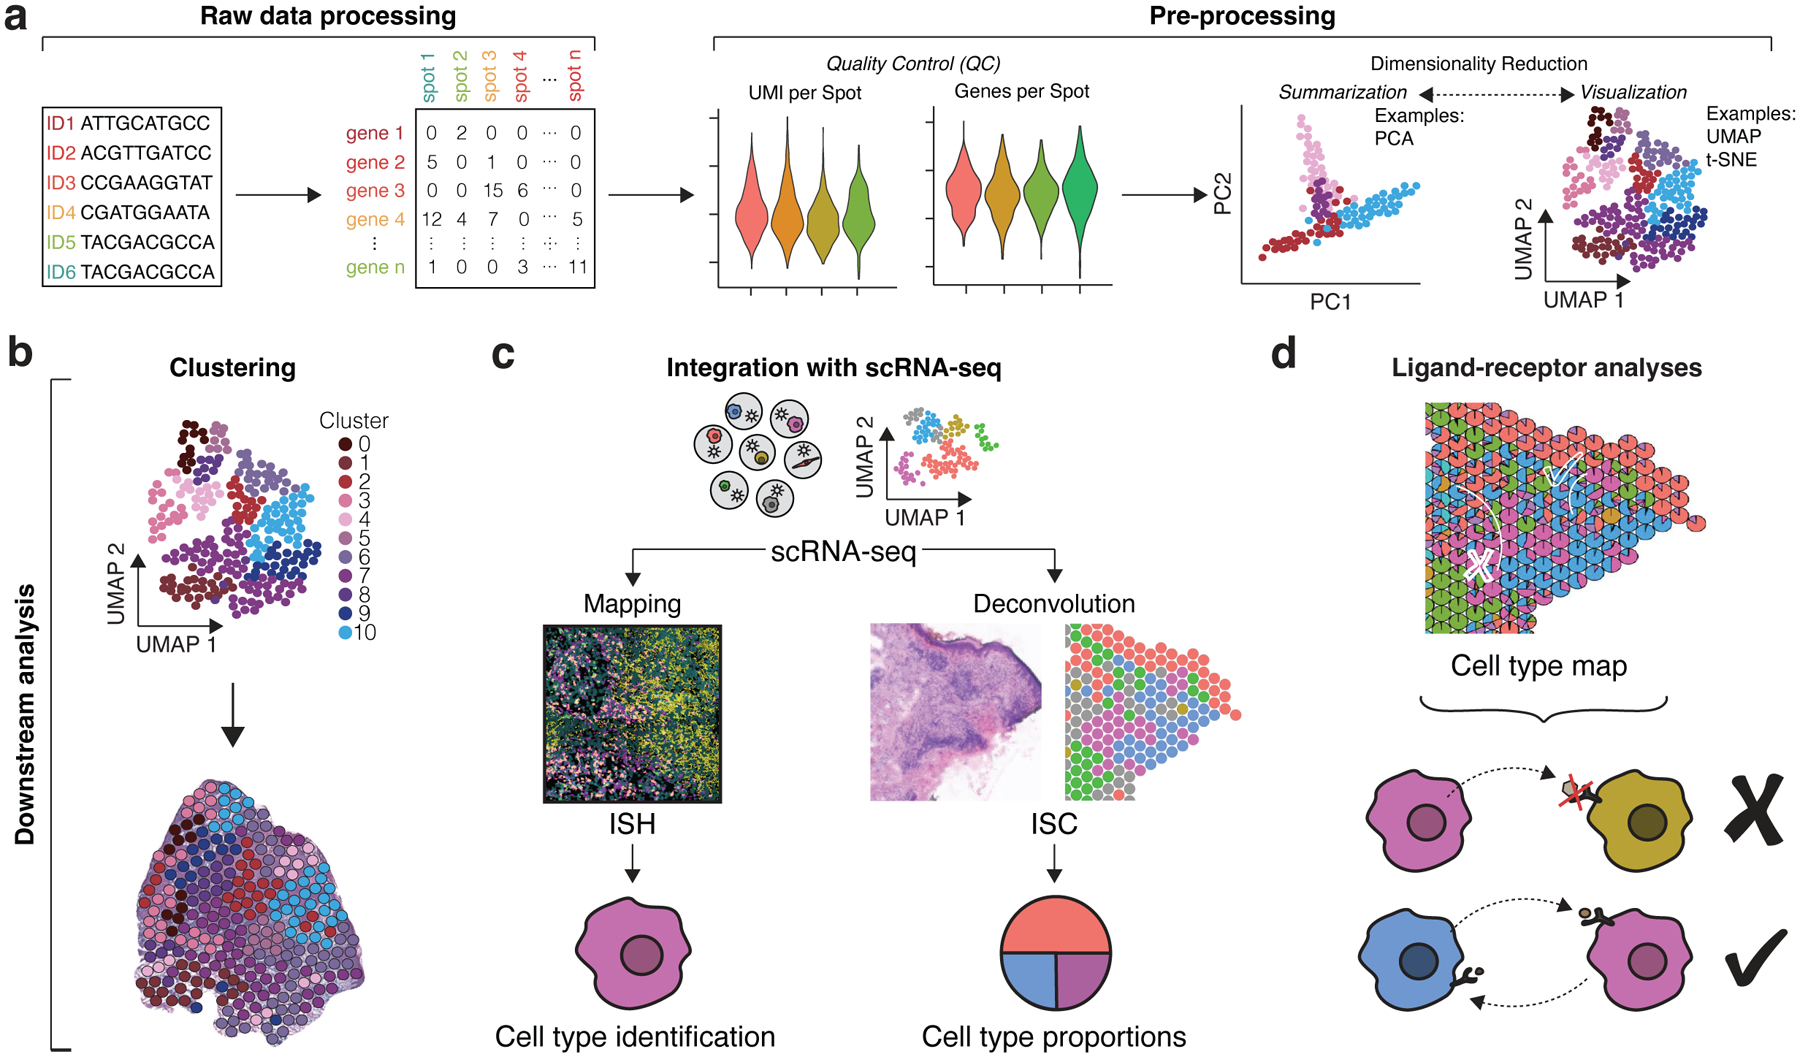
Figure 2. Data Analysis Workflows.

(a) For ISC, raw sequencing data is processed into count matrices consisting of genes and capture spots (this step varies depending on ST technique as ISH/ISS involve converting fluorescent imaging signal into similar count matrices). Pre-processing of matrices involves obtaining quality control metrics such as distributions of UMIs per spot (counts per spot) and genes per spot as well as data normalization. Dimensionality reduction methods include summarization methods (PCA) and visualization methods (UMAP and t-SNE), which both seek to reduce gene expression data into fewer dimensions for more informative analysis. (b) Clustering groups similar spot transcriptomes, which can be transposed over the original tissue images for general interpretation. (c) Mapping and deconvolution combine scRNA-seq data with spatial transcriptomics data to localize cell subpopulations. Mapping typically uses ISH data to localize scRNA-seq profiles and predict specific cell types within the tissue. Deconvolution typically uses ISC data to infer cell type proportions per capture spot. (d) Cell type maps generated from mapping and deconvolution can be applied for ligand-receptor analyses. The proximity of cell types can help infer cell-cell communication events. (c) and (d) were adapted with permission from Ma et al., Nature Immunology 2021.
