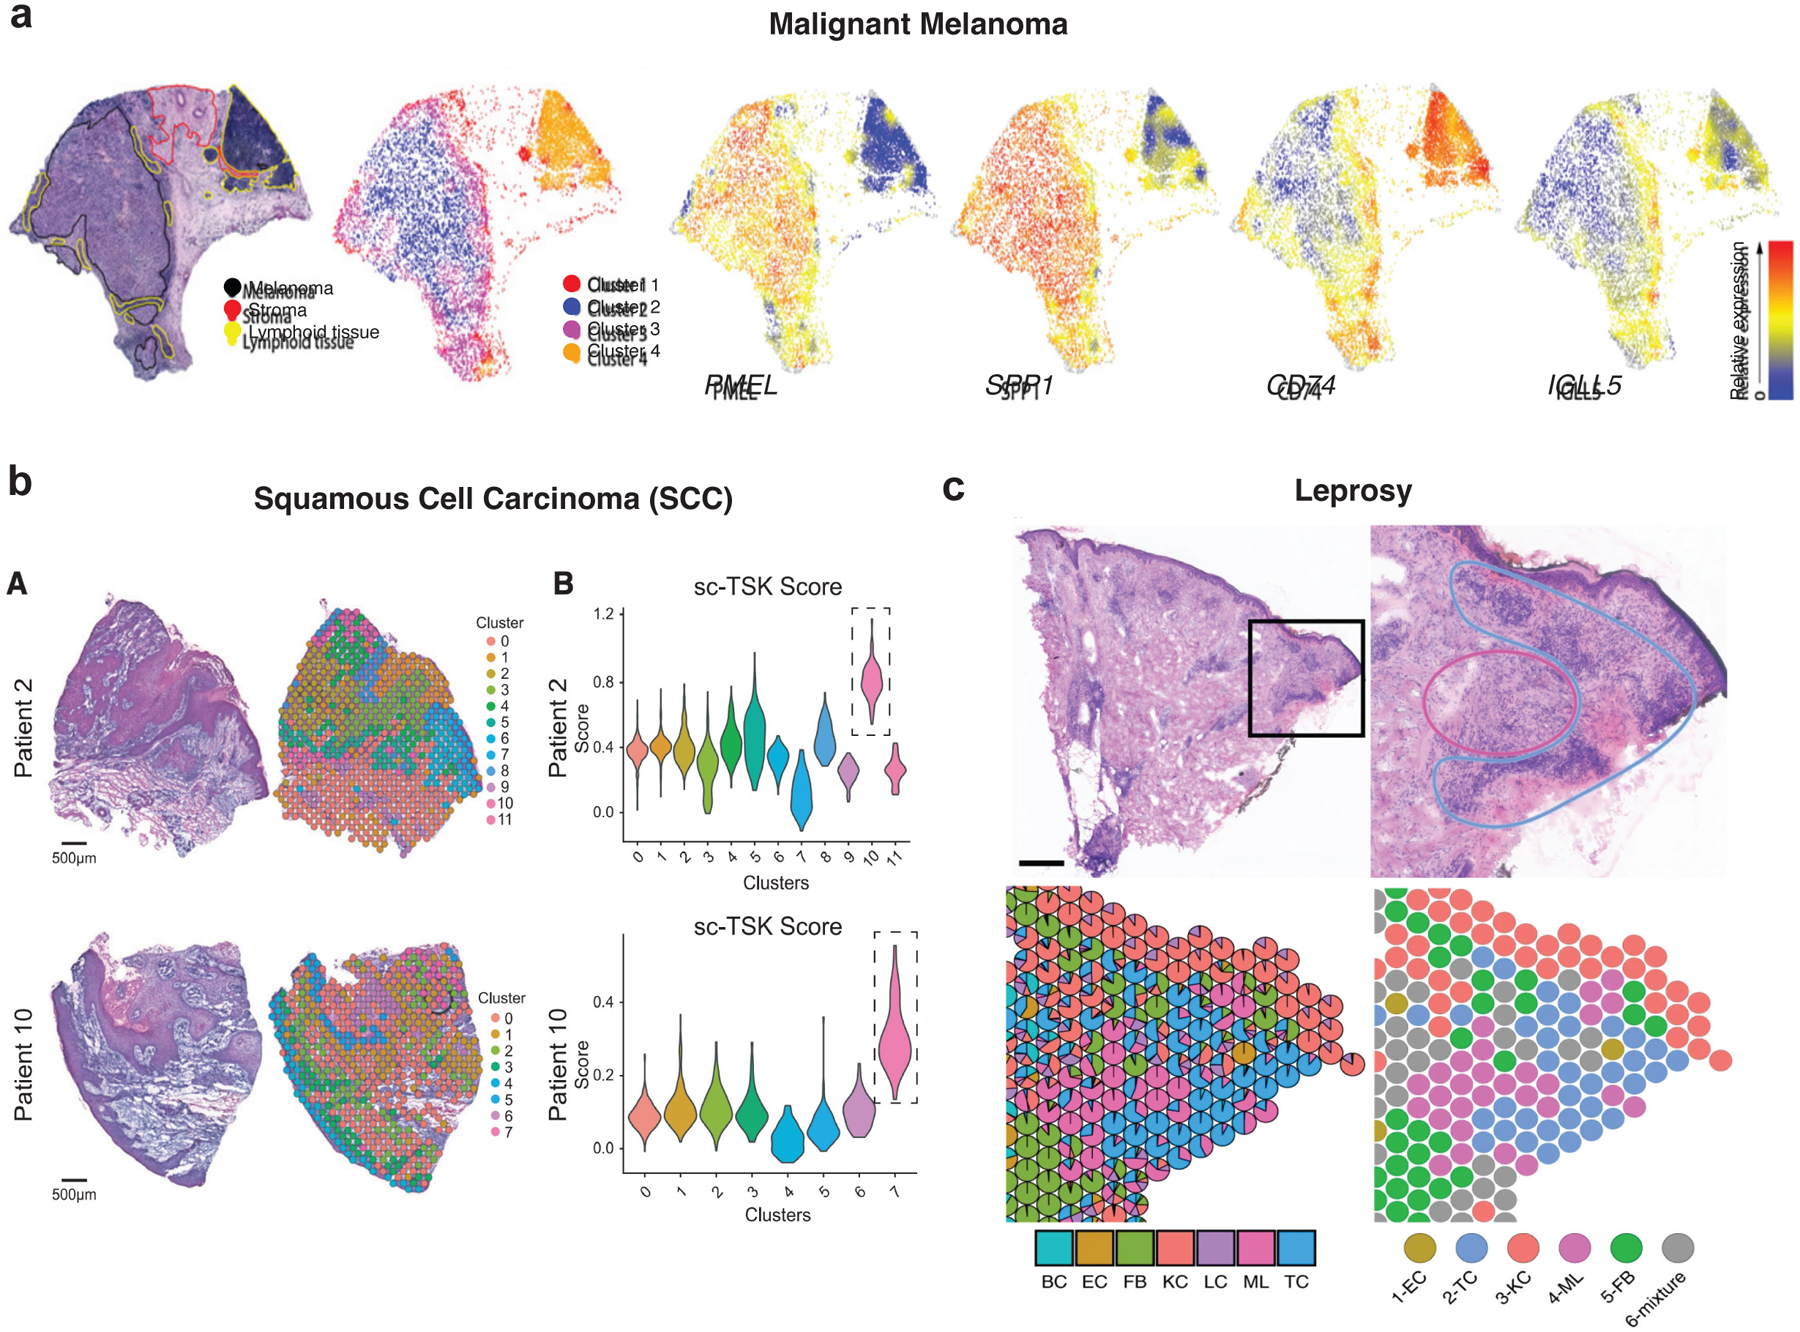
Figure 3. ST Applications in Dermatologic Research.

(a) ISC from lymph node biopsy of melanoma. Left, H&E staining with pathologic annotation and clustering. Lymphoid tissue occupies two clusters. Right, Spatial heatmaps of select highly-expressed and variable genes. Adapted with permission from Thrane et al., Cancer Research 2018. (b) Left, H&E staining and clustering of ISC spots in squamous cell carcinoma (SCC). Right, Violin plots of TSK scores of individual spots derived from scRNA-seq data (sc-TSK score) for each cluster. One spatial cluster within each sample demonstrates highest sc-TSK score (dotted boxes), highlighting areas occupied by this subpopulation. Reprinted from Ji et al., Cell 2020 under the CC BY 4.0 (https://creativecommons.org/licenses/by/4.0/legalcode). (c) Leprosy granuloma architecture and antimicrobial ecosystem. Top, H&E staining of a T-lep biopsy; bottom, cell type composition map showing myeloid cells in the granuloma center, while T cells and fibroblasts occupy the periphery. Scale bar: 0.5 mm. BC, B cell; EC, endothelial cell; FB, fibroblast; KC, keratinocyte; LC, Langerhans cell; ML, myeloid cell; TC, T cell. Reprinted with permission from Ma et al., Nature Immunology 2021.
