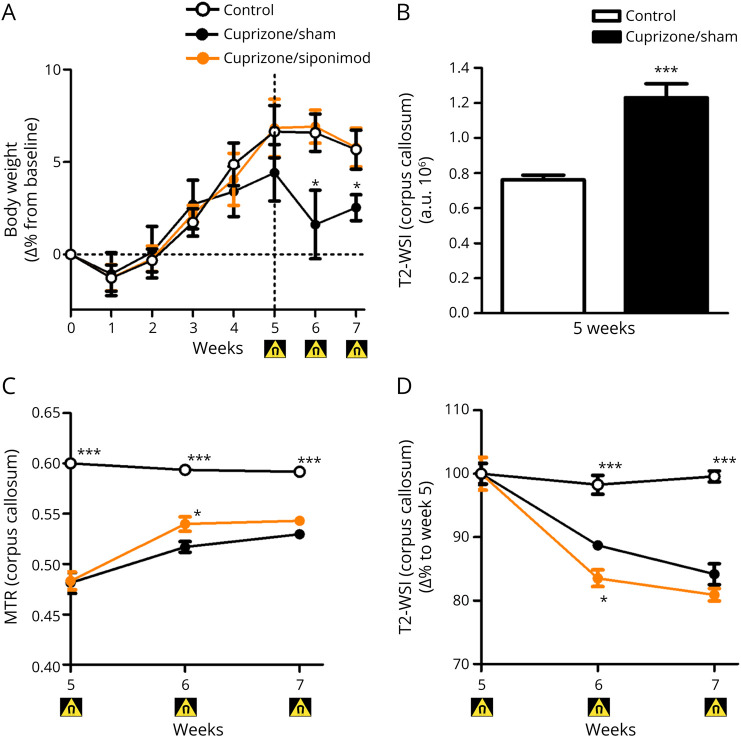
Figure 1. Siponimod Therapy Promotes Remyelination After Toxic Demyelination by Cuprizone.
(A) Longitudinal body weight changes in all study groups. (B) T2-WSI after 5 weeks. (C) Longitudinal MRI monitoring for magnetization transfer ratio changes in the CC. (D) Longitudinal T2-WSI monitoring for T2-WSI changes in the CC of mice in all study groups. Changes are expressed as mean ± SEM (n = 7 animals per group), and gray dots show individual data points. Magnet symbol indicates the timing for the MRI readouts. ***p < 0.001 compared by ANOVA with the Dunnett post hoc test for area under the curve bar graph and *p < 0.05 and ***p < 0.001 by ANOVA with random effects compared with the cuprizone/sham group for time courses. ANOVA = analysis of variance.

