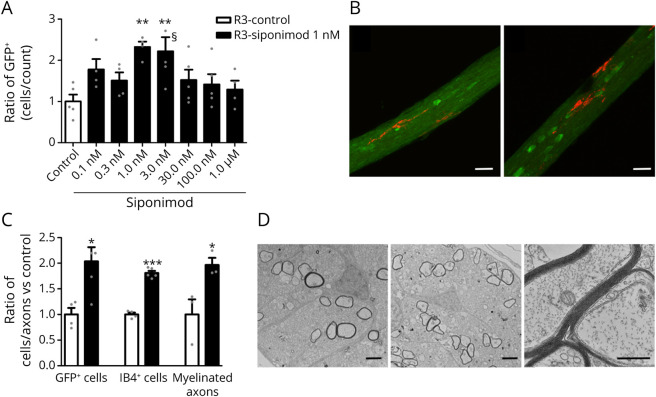
Figure 2. Spontaneous Remyelination of Transgenic Xenopus laevis With Siponimod Treatment; Effects on Microglia, Oligodendrocytes, and Remyelination.
Stage 52–53 transgenic Tg(mbp:GFP-NTR) Xenopus laevis tadpoles were exposed for 10 days in metronidazole (10 mM) before being returned in normal water or water containing increasing concentrations of siponimod. (A) Remyelination was assayed by counting the number of GFP + oligodendrocytes per optic nerve in vivo on day 3 (R3) of the repair period (n = 5–8 tadpoles per group). (B and C) After demyelination, animals were returned for 3 days to either normal water (Ctrl) or water containing siponimod (1 nM). Confocal images of oligodendrocytes (GFP+ green) and microglia (IB4+ red) in the optic nerve following spontaneous recovery (B, left) or siponimod treatment (B, right). Quantification of the effects of siponimod treatment on the number of myelin-forming (C, GFP+) oligodendrocytes and (C, IB4+) microglia (ctrl n = 4; siponimod n = 6). Electron micrograph of transversally cut optic nerve 3 days after either (D, left) spontaneous recovery or (D, middle) siponimod treatment. (D, right) Higher magnification of ongoing remyelination under siponimod treatment showing axons ensheathed with increasing number of myelin wraps. (C, myelinated axons) Quantification of the number of myelinated axons per optic nerve following siponimod treatment vs control of spontaneous remyelination (n = 5). Data are expressed as mean ± SEM, and gray dots show individual data points). **p < 0.01 calculated using 1-way ANOVA, followed by the Dunn post hoc test for (A) compared with control (Ctrl) condition. For C with *p < 0.05 and ***p < 0.001 (Student 2-tailed unpaired t test). Scale bars: B = 20 µm; D = 2 µm. §One data point out of axis limits. ANOVA = analysis of variance.

