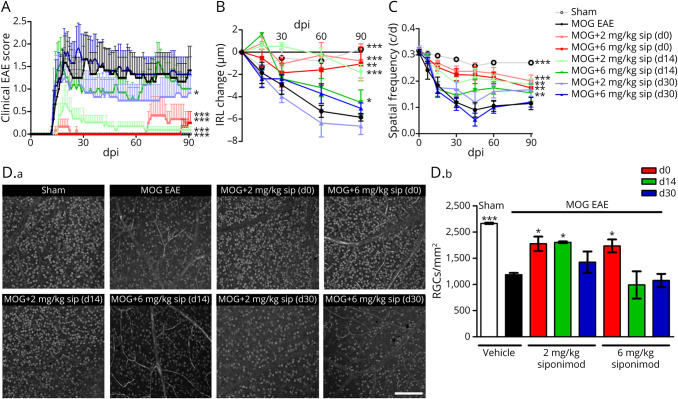
Figure 3. Siponimod Attenuates Myelin Oligodendrocyte Glycoprotein Fragment 35-55–Induced EAE in C57BL/6J Mice in a Dose- and Time-Dependent Manner.
(A) Clinical EAE score, (B) degeneration of the inner retinal layers, and (C) visual function by spatial frequency in cycles per degree (c/d) of female C57BL/6J EAE mice over 90 days of EAE. (D.a) Brn3a stained RGCs after 90 days of EAE of sham-, MOG EAE–, and siponimod-treated mice, scale bar = 200 μm. (D.b) The bar graph shows the RGC density 90 days after immunization. Siponimod was administered either on the day of immunization (d0), 14 days (d14) or 30 days (d30) post immunization (dpi). All graphs represent the pooled mean ± SEM, and gray dots show individual data points (out of 2 independent experiments each with n = 6 animals per group) with *p < 0.05, **p < 0.01, and ***p < 0.001, area under the curve compared by generalized estimating equation or ANOVA with the Dunnett post hoc test for time courses compared with untreated MOG EAE. *p < 0.05 and ***p < 0.001 by ANOVA with the Dunnett post hoc test compared with MOG EAE untreated mice for the bar graph. ANOVA = analysis of variance; EAE = experimental autoimmune encephalomyelitis; MOG = myelin oligodendrocyte glycoprotein; RGC = retinal ganglion cell.

