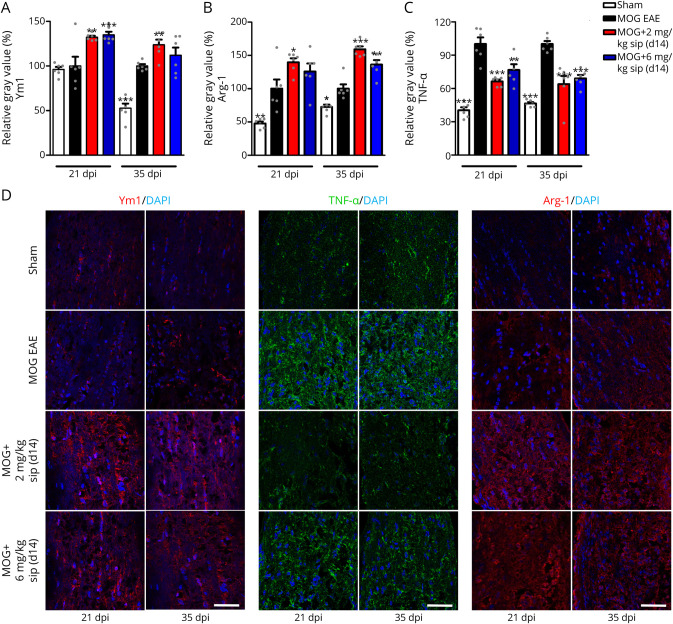
Figure 6. Siponimod Therapy Shifts Microglia to a Regenerative Phenotype.
Quantitative analysis of longitudinal sections of optic nerves of C57Bl/6J mice for Ym1 (A), TNF-α (B), and Arg-1 (C) at 21 and 35 days after myelin oligodendrocyte glycoprotein fragment 35-55 immunization. Representative images of the stainings (D), scale bar = 50 µm. One optic nerve per mouse was included for histologic examination. All graphs represent the pooled mean ± SEM, and gray dots show individual data points (n = 6 animals per group out of 2 independent experiments), with *p < 0.05, **p < 0.01, and ***p < 0.001 compared by ANOVA with the Dunnett post hoc test compared with untreated myelin oligodendrocyte glycoprotein experimental autoimmune encephalomyelitis. ANOVA = analysis of variance.

