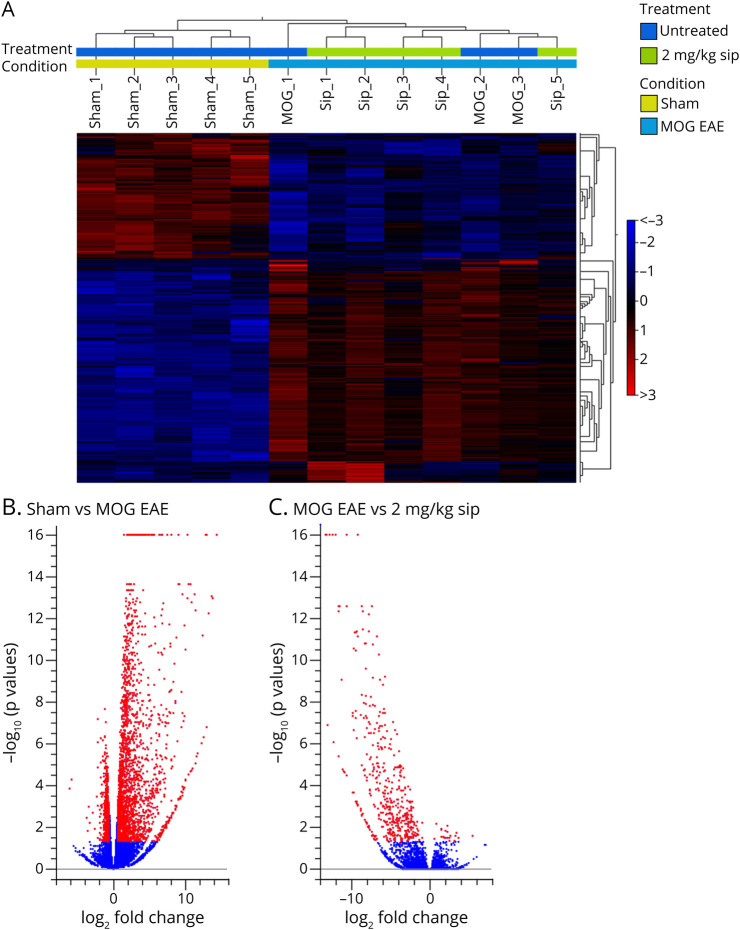
Figure 7. Gene Expression Profile of Optic Nerves of MOG EAE– and Siponimod-Treated Mice at 21 Dpi.
(A) Hierarchical clustering of differentially expressed genes after sham, MOG EAE, and MOG with 2 mg/kg BW siponimod treatment. Red indicates increased expression, and blue indicates decreased expression. Differences in expression were set to FC ≥ 1.5, with p(FDR) < 0.05. Volcano plot showing differentially expressed genes 21 dpi for (B) sham compared with MOG EAE animals and (C) MOG EAE compared with MOG with 2 mg/kg siponimod. For each plot, the x-axis represents log2 FC, and the y-axis represents −log10 (p values). DEGs are shown as red dots. EAE = experimental autoimmune encephalomyelitis; MOG = myelin oligodendrocyte glycoprotein.

