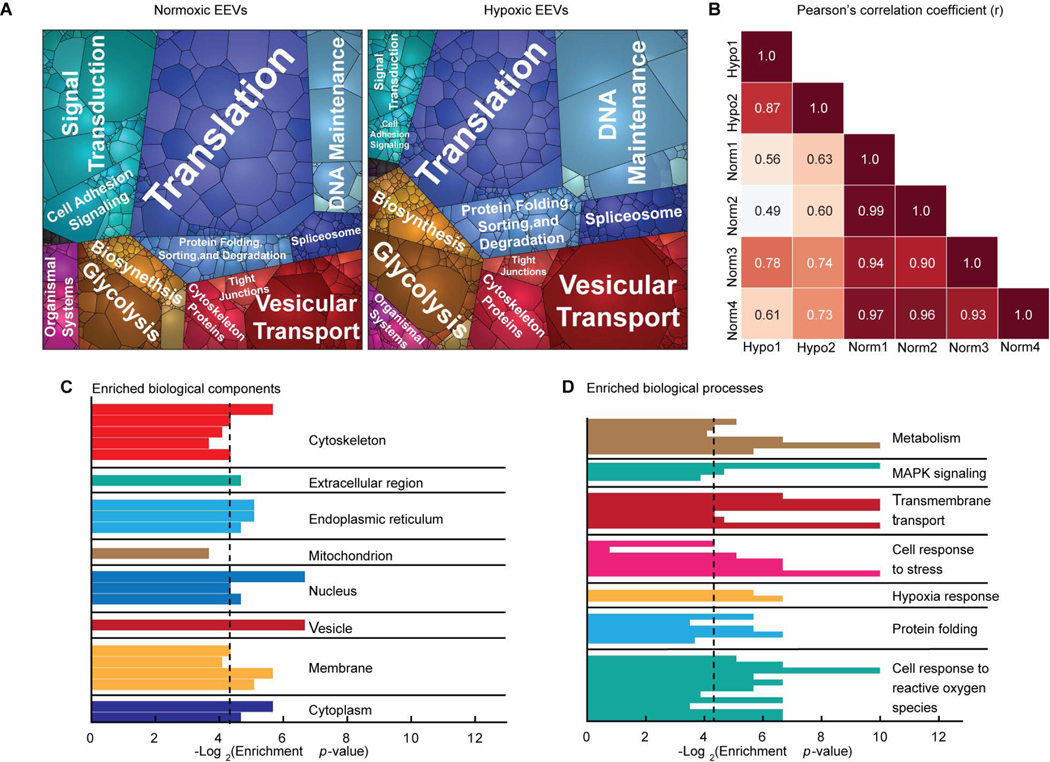
Fig. 2. Endothelial EVs characterization.
(A) Proteomaps illustrating the KEGG orthology terms and relative differences in mass abundance for the 1,820 proteins identified in normoxic (left, N=4) and hypoxic (right, N=2) EVs. (B) Sample-wise Pearson’s correlation analysis revealed a high degree of similarity between the global expression profiles for the normoxic (Norm) and hypoxic (Hypo) EV samples. Correlation coefficients between the four normoxic samples were greater than 0.9, and 0.87 for the two hypoxic samples. Gene ontology enrichment analysis identified statistically overrepresented (C) cellular localization and (D) biological function in the protein expression data set. Black vertical lines indicate P-value of 0.05.

