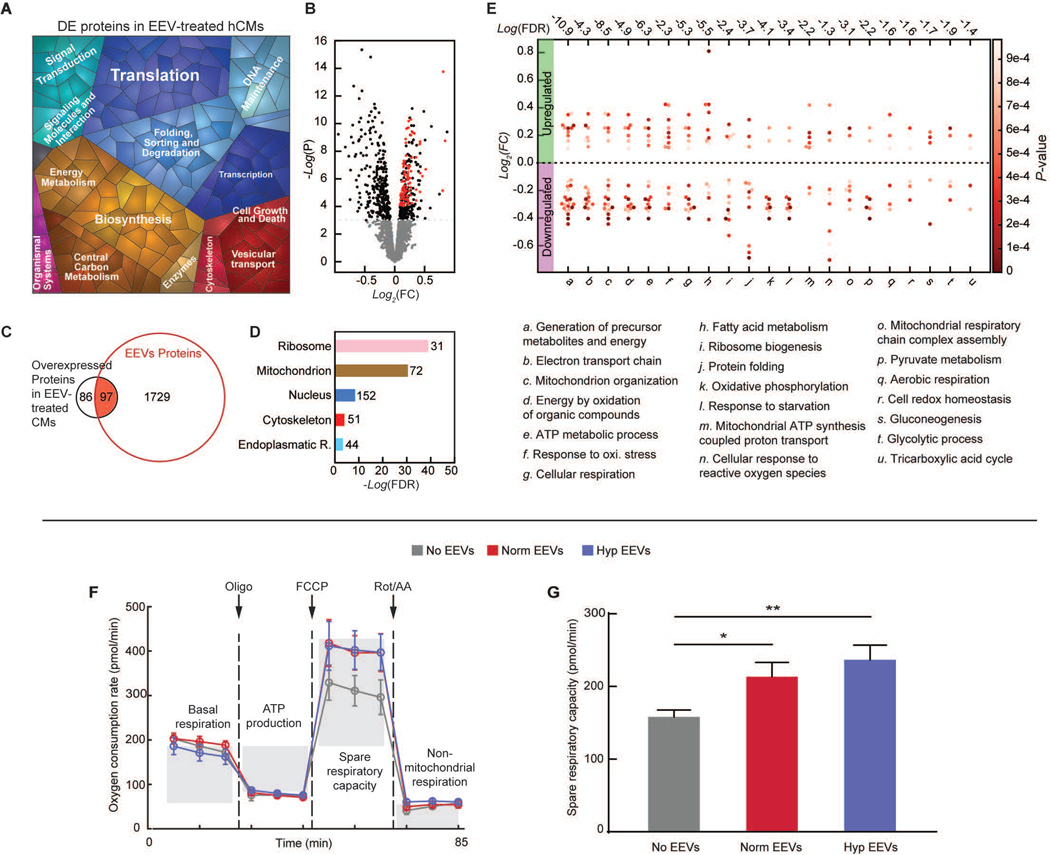
Fig. 3. Endothelial EVs’ effects on hCMs.
(A) Proteomap illustrating the KEGG orthology terms and relative differences in mass abundance for the significantly (P-value <0.05) differentially expressed proteins (DEPs) in EEV-treated (N=3 samples), compared with untreated (N=2 samples), hCMs. (B) Volcano plot presenting the fold change and p-value of the DEPs. The red dots represent proteins that were significantly overexpressed in the EEV-treated myocytes and also enriched in the EEVs. (C) A Venn diagram demonstrating the amount of the DEPs in the EEV-treated myocytes, relative to the normoxic EEVs’ proteome, and the overlap. (D) Cellular localization in the protein expression data set. The numbers next to the bars represent the number of significantly (P≤0.05) enriched proteins related to each of the depicted cellular compartments. (E) Dominant biological processes (BPs) in the DEPs. Each dot represents a single protein, whereas the clusters represent BPs. The red color scale represents the individual p-value for the enrichment of each protein in the data set. The dashed horizontal line represents 0-fold change, while all the dots above the line represent overexpressed proteins. The numbers above each cluster represent the false discovery rate, namely the confidence level in the representation of the specific BP. (F) Oxygen consumption rate (OCR, mean±s.e.m) of hCMs treated with vehicle (N=6), normoxic (Norm) EEVs (N=6), and hypoxic (Hyp) EEVs (N=6) was measured using Seahorse extracellular flux analyzer, while altering mitochondrial function to delineate the different components of respiration. (G) Spare respiratory capacity (mean±s.e.m) was calculated as the difference between the maximum and baseline OCR. Significance relative to untreated control was tested with one-way ANOVA. Statistical significance was presented by *P≤ 0.05, **P ≤ 0.01. P-values are detailed in data file S4.

