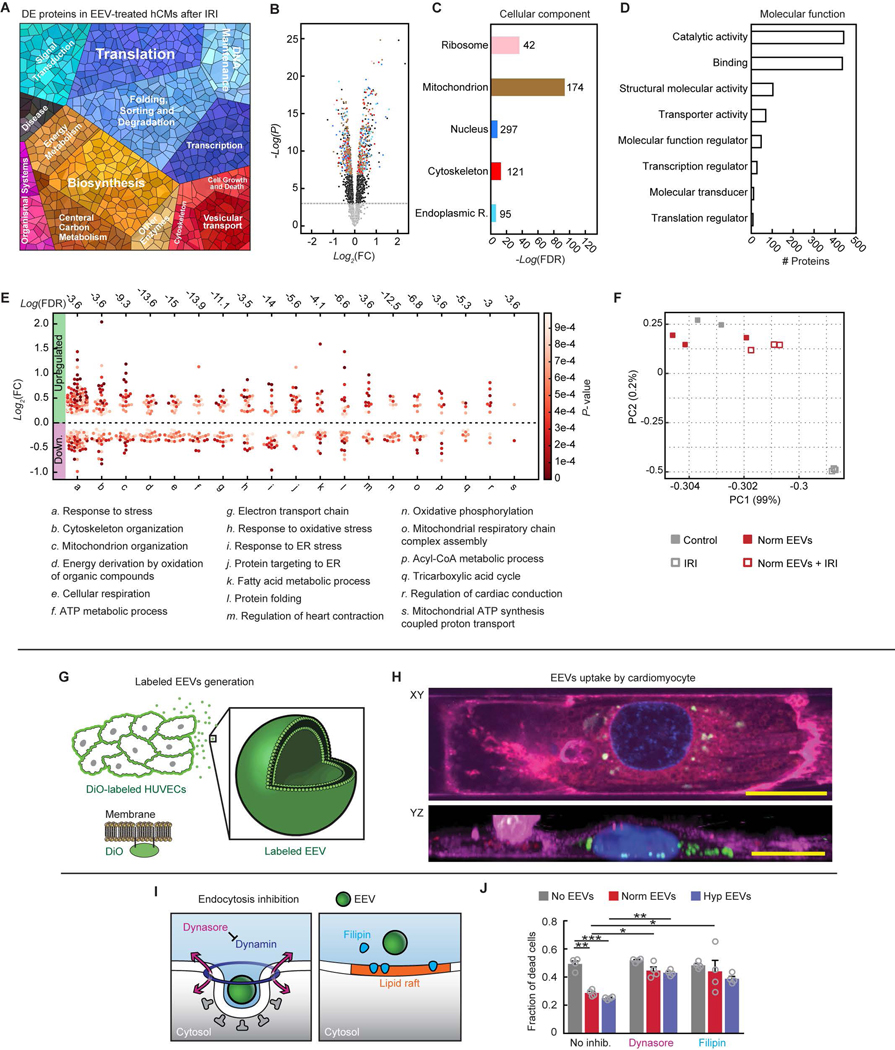
Fig. 6. Endothelial EVs’ effects on IR-injured hCMs.
(A) Proteomap illustrating the KEGG orthology terms and relative differences in mass abundance for the significantly (P-value <0.05) differentially expressed proteins (DEPs) in EEV treated (N=3 samples), compared with untreated (N=3 samples) IR-injured hCMs. (B) Volcano plot presenting the fold change and P-value of the DEPs. The colored dots represent proteins of the cellular components represented in panel C. (C) Cellular localization in the protein expression data set. The numbers next to the bars represent the number of significantly enriched proteins related to each of the depicted cellular compartments. (D) Molecular function in the protein expression data set shows modification of catalytic activity and binding. (E) Dominant biological processes (BPs) in the DEPs. Each dot represents a single protein, whereas the clusters represent BPs. The red color scale represents the individual P-value for each protein in the data set. The dashed horizontal line represents 0-fold change, while all the dots above the line represent overexpressed proteins. The numbers above each cluster represent the false discovery rate, namely the confidence level in the representation of the specific BP. (F) Two-dimensional principle component analysis of four treatment groups: Control – only hCMs (N=2), normoxic EEV-treated hCMs (Norm EEVs, N=3), IR-injured hCMs (IRI, N=3), and normoxic EEV-treated + IR-injured hCMs (Norm EEVs + IRI, N=3). (G) Schematic of production of DiO-labeled EEVs by prior labeling of cultured HUVECs’ plasma membranes. DiO-labeled EEVs could be detected using confocal microscopy. (H) XY and reconstructed YZ planes are presented 45 minutes after adding EEVs, showing internalization of the labeled EEVs (20 μm scale bars). Nuclei: blue; plasma membrane of cardiomyocytes: magenta; EEVs: green. (I) Schematic of two strategies to inhibit endocytosis in cardiomyocytes. Dynasore (left) inhibits dynamin, and Filipin (right) interrupts the lipid rafts. (J) Fraction of dead cells following IRI in the different treatment groups (9 experiment groups, N=4 for each group). Data is represented as mean±s.e.m, and tested with two-way ANOVA. Statistical significance was presented by *(P≤0.05), **(P≤0.01), ***(P≤0.001), ****(P≤0.0001). P-values are detailed in data file S4.

