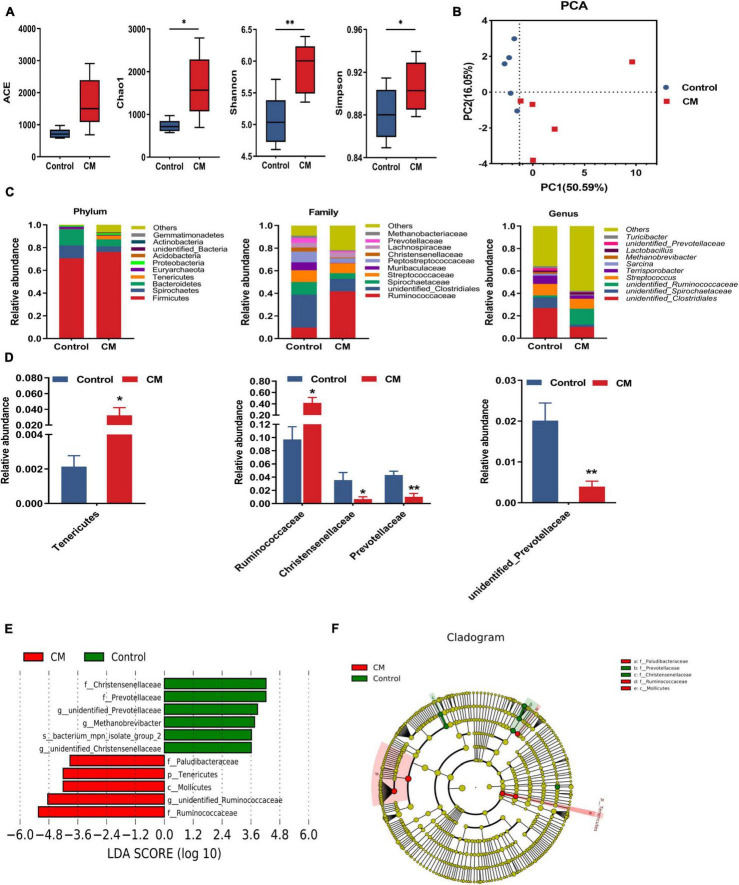
FIGURE 5.
CM changes the composition of the colonic microbiota. (A) Alpha diversity indexes (Ace, Chao1, Shannon, and Simpson) of colonic microbiota. (B) The principal component analysis (PCA) of colonic microbiota. (C) Microbiota compositions at the phylum level, family level, and genus level. (D) Statistical analysis of the differences in microbiota at the phylum level, family level, and genus level. (E) LDA score. Enriched taxa with an LDA score > 3.6 are shown in the histogram, control group-enriched taxa are indicated with a positive LDA score (green), and the taxa enriched by the CM group have a negative score (red). (F) LEfSe taxonomic cladogram. Taxa enriched in the CM group are shown in red, and taxa enriched in the Control group are shown in green. Control, pigs fed a basal diet; CM, pigs fed the basal diet supplemented with CM at 300 mg/kg. Data are presented as the mean ± SEM (n = 5). *P < 0.05, **P < 0.01.

