. 2022 Mar 18;14(13):5121–5137. doi: 10.1039/d1nr07647g

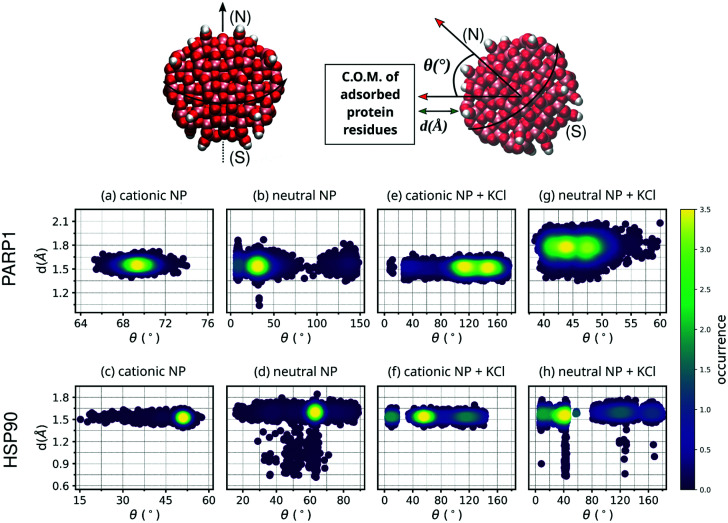
Fig. 3. Contour plot of NP angular orientation and closest distance between NP and protein over the last 50 ns of MD production. For the sake of clarity, DA ligands around the TiO2 NP core are not shown. The following letter codes stand for: (a) PARP1 and cationic NP complex at pH 7.4, (b) PARP1 and neutral NP complex at pH 11.5, (c) HSP90 and cationic NP at pH 7.4, and (d) HSP90 and neutral NP complex at pH 11.5, (e) PARP1 and cationic NP at pH 7.4 + KCl at 0.15 M, (f) HSP90 and cationic NP at pH 7.4 + KCl at 0.15 M, (g) PARP1 and neutral NP at pH 11.5 + KCl at 0.15 M, (h) HSP90 and neutral NP at pH 11.5 + KCl at 0.15 M. Top: Definition of angular orientation and closest distance descriptors estimate to the protein–NP complex over the MD production phase are given in section 3.1.

Fig. 3