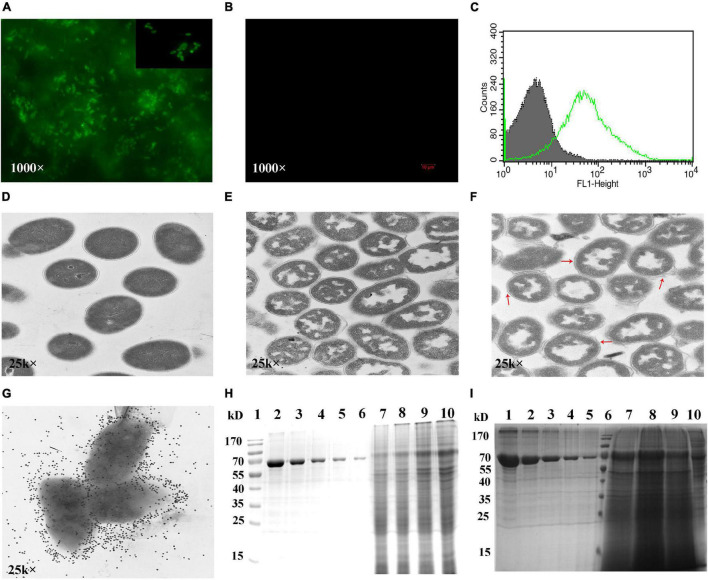
FIGURE 4.
Detection of fusion protein displayed on the surface of GEM particles. IFA experiment detection of RVFV-BLPs labeled by goat antimouse FITC (A) and no fluorescence found in GEM particles (B). FACS histograms of RVFV-BLPs (green) and GEM particles (gray) (C). TEM and immunogold labeling images of RVFV-BLPs, L. lactis MG1363 (D), GEM particles (E) and RVFV-BLPs (F). Fusion protein on the surface of GEM particles detected by immunogold labeling (G). The maximum binding capacity of the fusion protein displayed on GEM particles was determined by SDS-PAGE (H,I). In (H), lane 1 is protein marker, lanes 2–6 are BSA, 0.5–0.03125 mg/ml. 1U GEM particles mixed with 1 (lane 7), 2 (lane 8), 3 (lane 9), and 4 mL (lane 10). In (I), lanes 1–5 are BSA, 0.5–0.03125 mg/ml. Lane 6 is protein marker, 1U GEM particles mixed with 6 (lane 7), 8 (lane 8), 10 (lane 9), and lane 10 is the supernatant containing RVFV Gn head-PA fusion protein.

