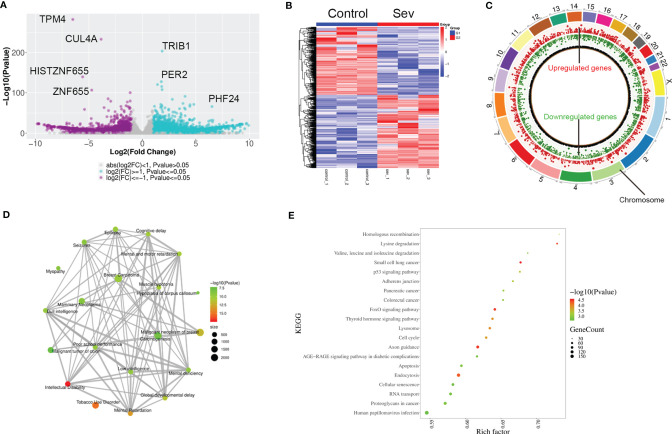
Figure 2.
Profiling of RNAs in Sev-treated U251 cells. (A) The volcano figure showing the variation in 5.1% Sev-treated U251 cells and the control. The purple plot indicates RNAs with greater than 2.0-fold upregulation between the two compared groups, while the blue plot indicates the downregulated RNAs. (B) A heat map showing the upregulated and downregulated genes in Sev-treated U251 cells compared to the control. Each row corresponds to an RNA, each line to a sample. A Higher expression level is indicated by red, and lower level is indicated by blue. (C) The distribution of differentially expressed RNAs on chromosomes. The outer circle indicated each chromosome, the red inner circle indicated upregulated genes and their fold change, and the green inner circle indicated downregulated genes and their fold change. (D) GO analysis of significantly dysregulated genes. (E) KEGG pathway analysis of significantly dysregulated genes.

