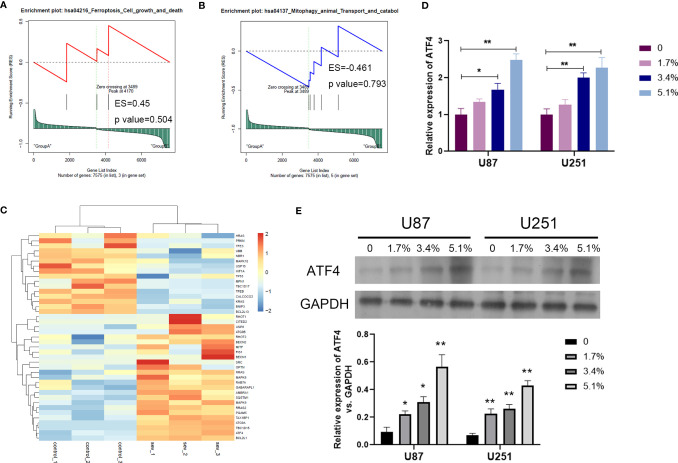
Figure 3.
Sev upregulated ferroptosis-associated gene ATF4 in glioma cells. (A) Representative GSEA plot depicting ferroptosis involved in Sev-treated U251 cells. (B) Representative GSEA plot depicting mitophagy involved in Sev-treated U251 cells. (C) A heat map showing the upregulated and downregulated genes involved in ferroptosis and mitophagy in Sev-treated U251 cells compared to the control. Each row corresponds to a RNA, each line to a sample. Higher expression level is indicated by yellow, and lower level is indicated by blue. (D) The mRNA levels of ATF4 in Sev-treated U87 and U251 cells were detected by qRT-PCR. (E) The protein level of ATF4 in Sev-treated U87 and U251 cells was detected by Western blotting. Data were expressed as mean ± standard deviation. *p < 0.05, **p < 0.01, compared with control, GAPDH is used as internal control.

