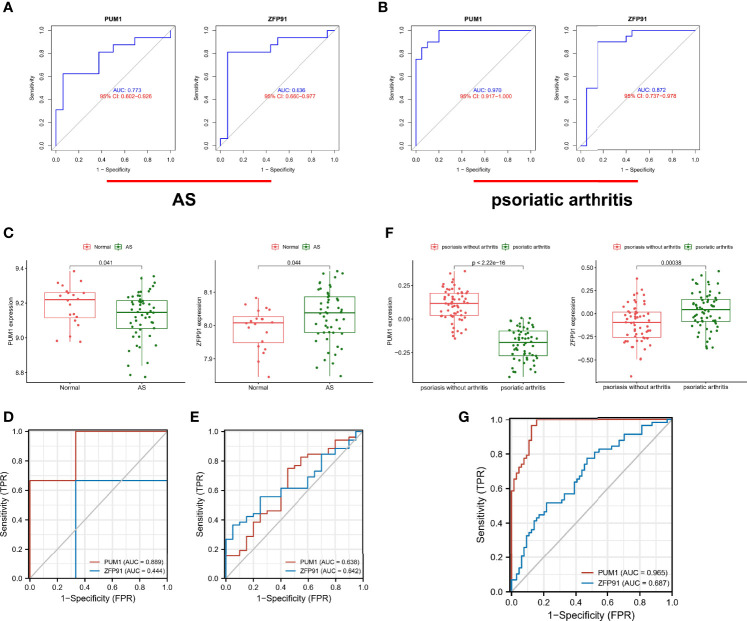
Figure 6.
Validation of diagnostic shared biomarkers. (A) The ROC curve of the diagnostic efficacy verification in GSE25101. (B) The ROC curve of the diagnostic efficacy verification in GSE61281. (C) The shared biomarkers in GSE73754 showed significant differences, with p value < 0.05. (D) The ROC curve of the diagnostic efficacy verification in data of samples from our hospital. (E) The ROC curve of the diagnostic efficacy verification in GSE73754. (F) The shared biomarkers in GSE13355 showed significant differences, with p value < 0.05. (G) The ROC curve of the diagnostic efficacy verification in GSE13355.

