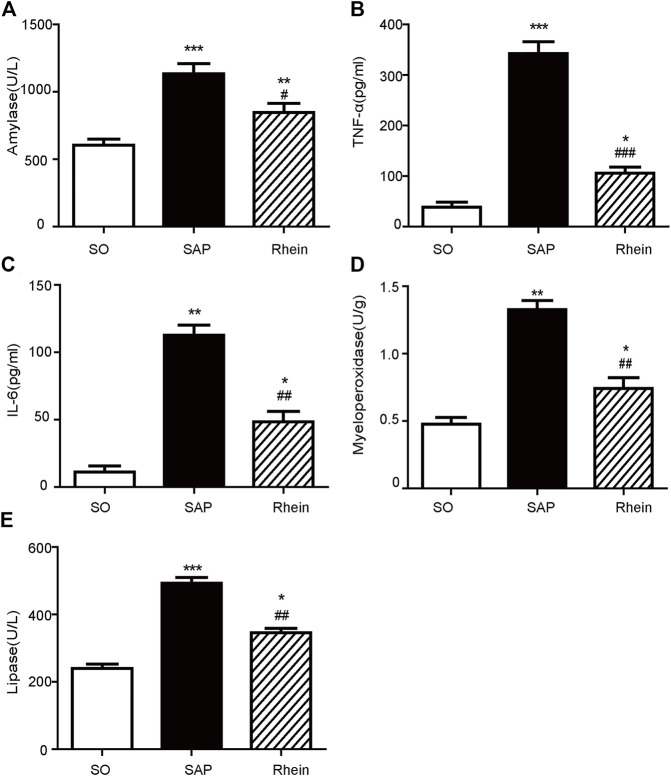
FIGURE 3.
Effects of rhein on the inflammatory cytokine levels in pancreatic tissue of the SAP rat model. (A) Serum amylase levels in the SO, SAP and rhein groups. (B) Serum TNF-α levels in the SO, SAP and rhein groups. (C) Serum IL-6 levels in the SO, SAP and rhein groups. (D) Myeloperoxidase levels in the SO, SAP and rhein groups. (E) Serum lipase levels in the SO, SAP and rhein groups. Data are expressed as mean ± SD (n = 5 per group). Significance between groups was evaluated by one way analysis of variance (ANOVA) followed by a Tukey post hoc test. *p < 0.05, **p < 0.01 and ***p < 0.001 compared with the SO group; # p < 0.05, ## p < 0.01 and ### p < 0.001 compared with the SAP group. SO, sham operation; SAP, severe acute pancreatitis; TNF-α, tumour necrosis factor-α; IL-6, interleukin-6.

