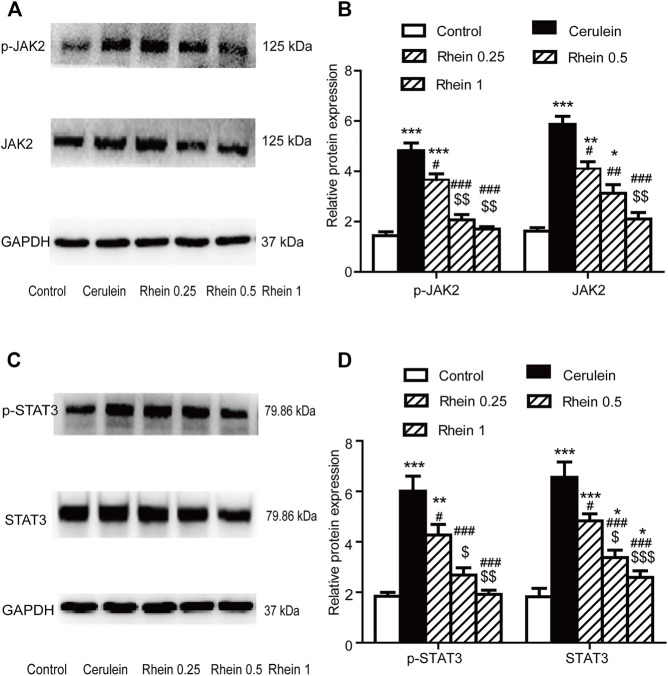
FIGURE 8.
The protein expression of p-JAK2, JAK2, p-STAT3 and STAT3 in the AR42J cell model was measured by western blot. (A,B) p-JAK2 and JAK2 protein expression in the control, cerulein, rhein 0.25 μg/ml, rhein 0.5 μg/ml and rhein 1 μg/ml groups. (C,D) p-STAT3 and STAT3 protein expression in the control, cerulein, rhein 0.25 μg/ml, rhein 0.5 μg/ml and rhein 1 μg/ml groups. Data are expressed as mean ± SD (n = 5 per group). Significance between groups was evaluated by one way analysis of variance (ANOVA) followed by a Tukey post hoc test. *p < 0.05, **p < 0.01 and ***p < 0.001 compared with the control group; # p < 0.05, ## p < 0.01 and ### p < 0.001 compared with the cerulein group; $ p < 0.05, $$ p < 0.01 and $$$ p < 0.001 compared with the rhein 0.25 μg/ml group. JAK2, janus kinase two; STAT3, signal transducer and activator of transcription 3.

