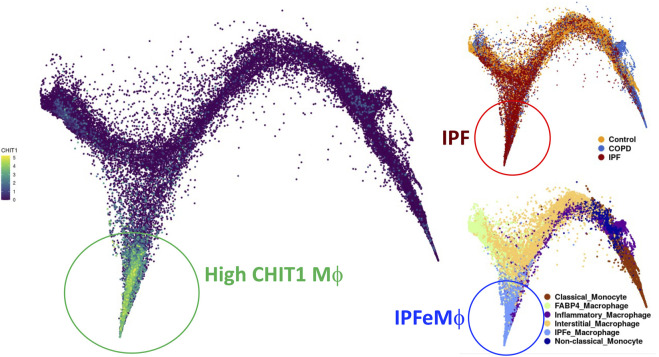
FIGURE 1.
UMAP (uniform manifold approximation and projection) clustering of lung macrophages in patients with IPF evaluated by single cell RNAseq analysis. Highly CHIT1 expressing macrophages (green, left) are overlapping with macrophage subset of patients with IPF (dark brown, upper right) but not with control or COPD patients (blue or bright brown, right upper). It is also notable that most of these CHIT1 expressing macrophages are significantly overlapping with IPF expanded macrophages (IPFeMϕ) (Blue, right lower), the distinct subset of profibrotic macrophages noted in IPF patients. Publicly available RNAseq data (http://www.ipfcellatlas.com/; Single cell RNA-seq, 2021, Ivan Rosas group) was re-plotted for CHIT1 expressing macrophages.

