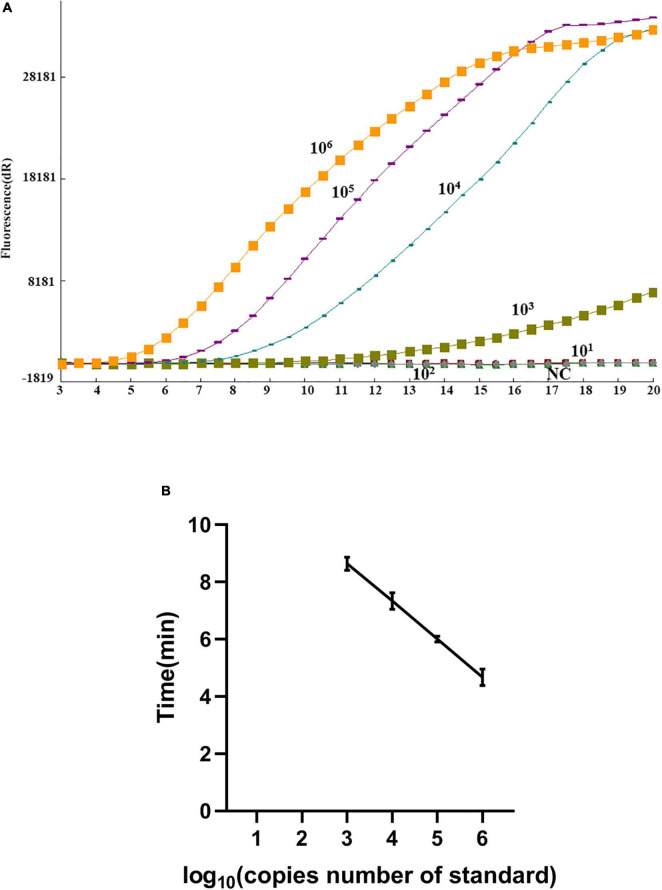
FIGURE 2.
Sensitivity of the real-time recombinase-aid amplification (RAA) assay. (A) Amplification curve of the real-time RAA assay over time using a dilution range of 106–101 copies/reaction of pASFV/RAA. (B) Reproducibility of the real-time RAA assay. The threshold time is represented as the mean ± standard deviation (SD). The standard regression line was generated based on three datasets. NC, negative control.

