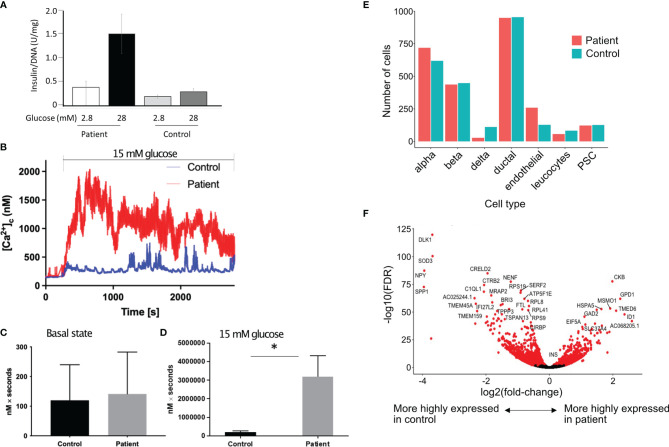
Figure 2.
Increased insulin secretion by the islets. (A) In vitro glucose stimulated insulin secretion of isolated islets cells. Data show mean ± SD of 3 replicates. (B) Increase in cytoplasmic calcium level (which triggers degranulation of insulin granules) in response to 15 mM glucose in patient’s islets (red) as compared to control islets (blue). (C, D) Area under the curve (expressed as nM x seconds) of cytoplasmic calcium in islets in the basal state (C) and during stimulation with 15 mM of glucose (D). Data show mean ± SD of 3 replicates. *p=0.0289, 2 tailed unpaired t test. (E) Proportion of different cell types in the islets from the patient as compared to a single control using 10X single cell sequencing. (F) Volcano plot showing differentially expressed genes in the β cells of patient’s islets as compared to control islets.

