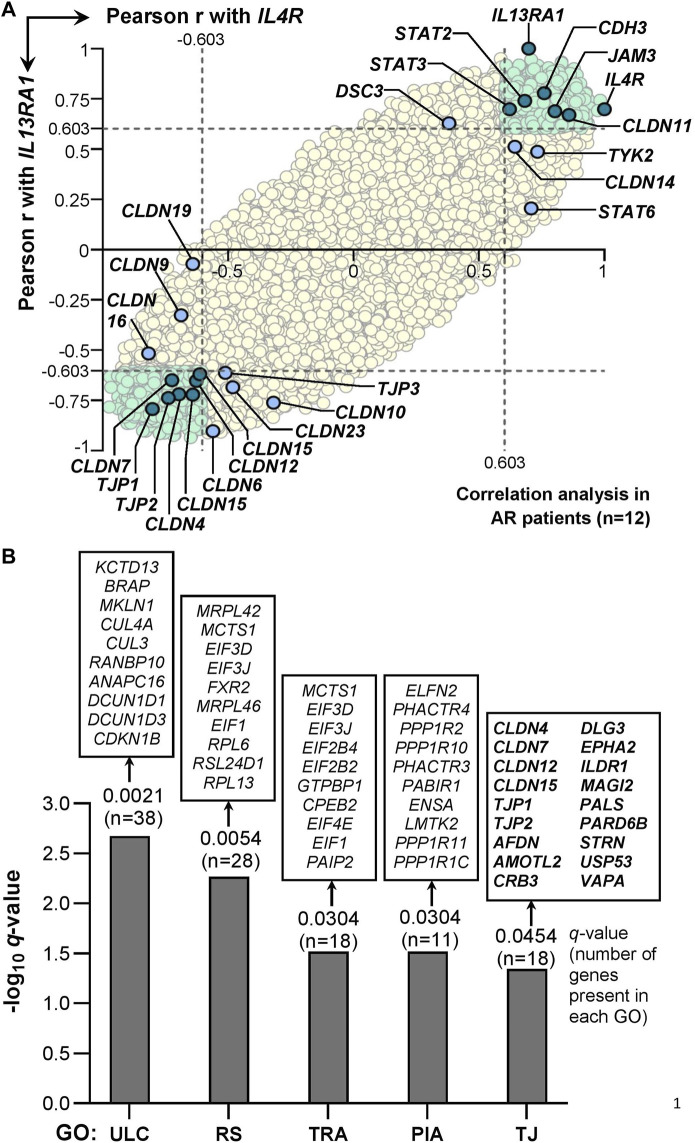
FIGURE 3.
Correlation of IL-4 receptor heterodimer subunits expression (i.e., IL4R or IL13RA1) with 20,541 annotated genes in AR patients derived from GSE44037 dataset. (A) Pearson correlation of the genes expression levels with IL4R or IL13RA1 expression levels in AR patients (n = 12). The Pearson r value ± 0.603 is used as the cut-off (i.e. the dotted lines) to define positive (r > 0.603) or negative (r < −0.603) correlation with IL4R or IL13RA1 as this cut-off represents significant (i.e. p < 0.05) Pearson correlation for a sample size of 12. All genes significantly correlated with both IL4R and IL13RA1 expression levels are highlighted in light green. TJ, desmosomal or JAK/STAT signaling genes with significant correlation with both IL4R and IL13RA1 expression levels are highlighted in teal. TJ, desmosomal or JAK/STAT signaling genes with significant correlation with either IL4R or IL13RA1 expression levels only are highlighted in light blue. The rest of the background genes are highlighted in yellow. (B) Gene Ontology (GO) enrichment analysis of genes inversely associated with IL4R and IL13RA1 expression (GSE44037 dataset). Ten representative genes are displayed on top of each bar, and all 18 genes contributed to the enrichment of TJ ontology (GO ID: 0070160) are shown. ULC: Ubiquitin ligase complex; RS: Ribosomal subunit; TRA: Translation regulator activity; PIA: Phosphatase inhibitor activity; TJ: Tight junction.

