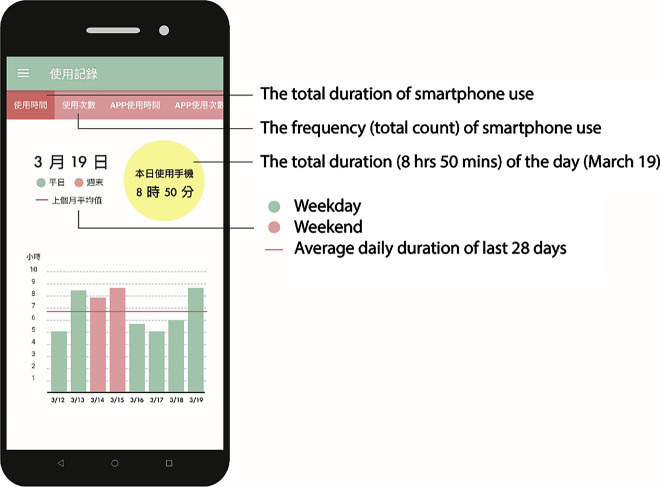
Fig. 3.
Screenshot of app user interface of smartphone use. This screenshot of the “Know Addiction” app user interface shows the weekly summary of the daily time spent on the smartphone. In the yellow circle is the total duration (8 h 50 min) for the day (March 19), while the lower part of the screenshot reveals the total duration of each day of the past week. The smartphone's usage varied between weekdays (in green) and the weekend (in pink). This app continuously collects data without active data entry by the smartphone users and provides the average daily duration of the past 28 days (February 21 to March 19) of the user. This average appears as a red horizontal line and serves as a personalized reference of the average time spent on the smartphone (6 h 50 min)

