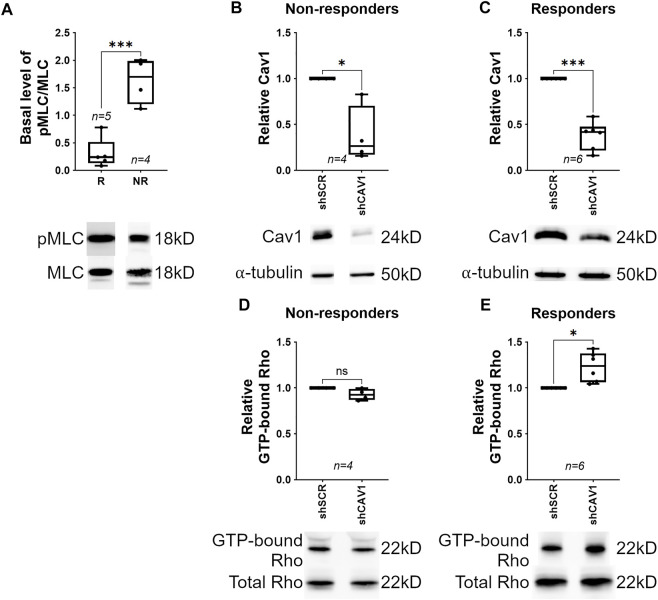
FIGURE 3.
Cav1-knockdown elevates MLC phosphorylation via Rho activation in human TM cells. Responders (R) are defined as TM cells where MLC phosphorylation levels were elevated following Cav1 knockdown. Non-responders (NR) are defined as TM cells where MLC phosphorylation levels were not elevated following Cav1 knockdown. ((A), Top) Basal MLC phosphorylation was significantly higher in NR (n = 4 experiments using four different human TM cell strains) compared to responders (R, n = 5 experiments using four different human TM cell strains) (***p = 0.0007, unpaired t-test). ((A), Bottom) Shown is a representative blot from a single experiment displaying phosphorylated MLC abundance, compared to total MLC protein. ((B), Top) In non-responders, Cav1 protein levels were significantly decreased by approximately 60% in TM cells treated with CAV1-silencing shRNA compared to cells treated with scrambled shRNA (*p = 0.027, paired t-test, n = 4 experiments using four different human TM cell strains). ((B), Bottom) Shown is a representative blot from a single experiment displaying Cav1 protein abundance, compared to α-tubulin. ((C), Top) In responders, Cav1 protein levels were comparable to non-responders being decreased by approximately 60% in TM cells treated with CAV1-silencing shRNA compared to cells treated with scrambled shRNA (***p = 0.0002, paired t-test, n = 6 experiments using four different human TM cell strains). ((C), Bottom) Shown is a representative blot from a single experiment displaying Cav1 protein abundance, compared to α-tubulin. ((D), Top) In non-responders, levels of GTP-bound Rho were not significantly different between Cav1-competent and Cav1-deficient TM cells (p = 0.097, paired t-test analysis, n = 4 experiments using four different human TM cell strains). ((D), Bottom) Shown is a representative blot from a single experiment displaying GTP-bound Rho signal, normalized to total Rho protein. ((E), Top) In contrast, GTP-bound Rho in responders was significantly elevated by approximately 23% in Cav1-deficient compared to Cav1-competent TM cells. (p = 0.017, paired t-test, n = 6 experiments using four different human TM cell strains). ((E), Bottom) Shown is a representative blot from a single experiment displaying GTP-bound Rho signal, normalized to total Rho protein. Summary data are displayed as box and whisker plots, which show the minimum, 25th percentile, median, 75th percentile, and maximum values of the dataset, plus all individual data points (black circles). In A-C, data are expressed as candidate protein expression, corrected for loading as indicated by α-tubulin abundance. For D and E, expression of GTP-bound Rho is corrected for loading via normalization to total Rho, and not α-tubulin. For B-E, data are expressed as candidate protein expression in cells treated with shCAV1, normalized to shSCR treated cells.

