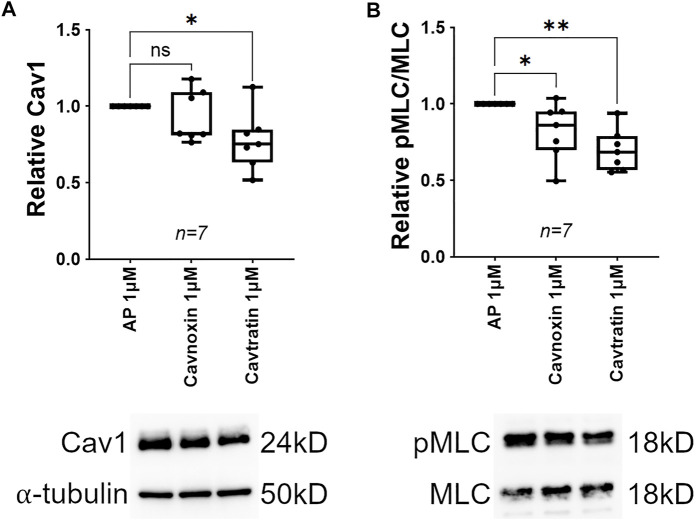
FIGURE 4.
Cav1 scaffolding domain mimetics cause MLC dephosphorylation in human TM cells. ((A), Top) Treatment with the peptide mimetic, cavnoxin (1 μM) for 24 h had no effect on Cav1 protein levels compared to 1 μM peptide control (Antennapedia internalization sequence, AP) (p = 0.333, paired t-test, n = 7 experiments using three different human TM cell strains). Treatment with the peptide mimetic, cavtratin (1 μM) for 24 h significantly reduced Cav1 protein levels by 22% compared to 1 μM AP (*p = 0.021, paired t-test, n = 7 experiments using three different human TM cell strains). ((A), Bottom) Shown is a representative blot from a single experiment displaying Cav1 protein abundance, compared to α-tubulin. ((B), Top) Treatment with 1 μM cavnoxin for 24 h significantly reduced MLC phosphorylation by 18% compared to 1 μM AP (*p = 0.046, paired t-test, n = 7 experiments using three different human TM cell strains). Treatment with 1 μM cavtratin for 24 h significantly reduced MLC phosphorylation by 30% compared to 1 μM AP (**p = 0.001, paired t-test, n = 7 experiments using three different human TM cell strains). ((B), Bottom) Representative blots from a hTM cell strain depicting pMLC signal, normalized to total MLC. Summary data are displayed as box and whisker plots, which show the minimum, 25th percentile, median, 75th percentile, and maximum values of the dataset, plus all individual data points (black circles). Data are expressed as candidate protein expression (corrected for loading as indicated by α-tubulin abundance) in cells treated with cavtratin or cavnoxin, normalized to AP-treated cells.

