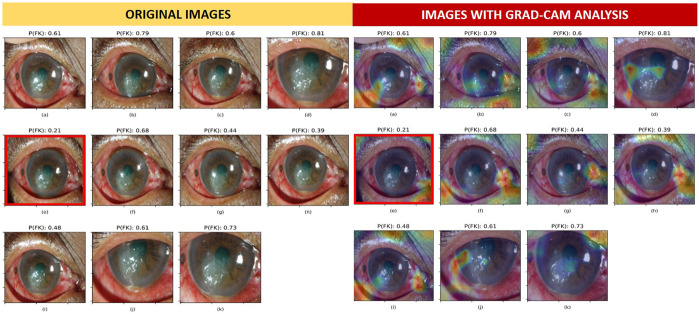
FIGURE 3.
Misclassification analysis using Grad-CAM in patients with FK. The optimal decision threshold of FK in VGG19 was 0.39. The probability of FK [P(FK)] is presented at the top of each image. The overlay heatmap with Grad-CAM analysis highlighted the areas that influenced model prediction. Image (E) was misclassified as BK with the P(FK) of 0.21; this was lower than the decision threshold.

