FIGURE 4.

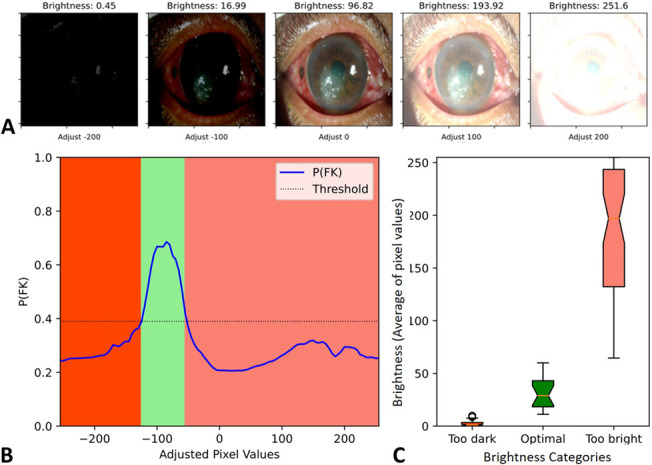
Variation of prediction probability on brightness adjustment in a misclassified image. A, Images with brightness adjustment by adding a constant of −200, −100, 0, 100, and 200 to all pixels and (B) graph demonstrates prediction probability (y axis) at different pixel value adjustments (x axis). C, Box plot illustrates an optimal brightness range of image for achieving correct classification which was 24.70 (range 9.63–45.20). The lower and higher image brightness can lead to image misclassification.
