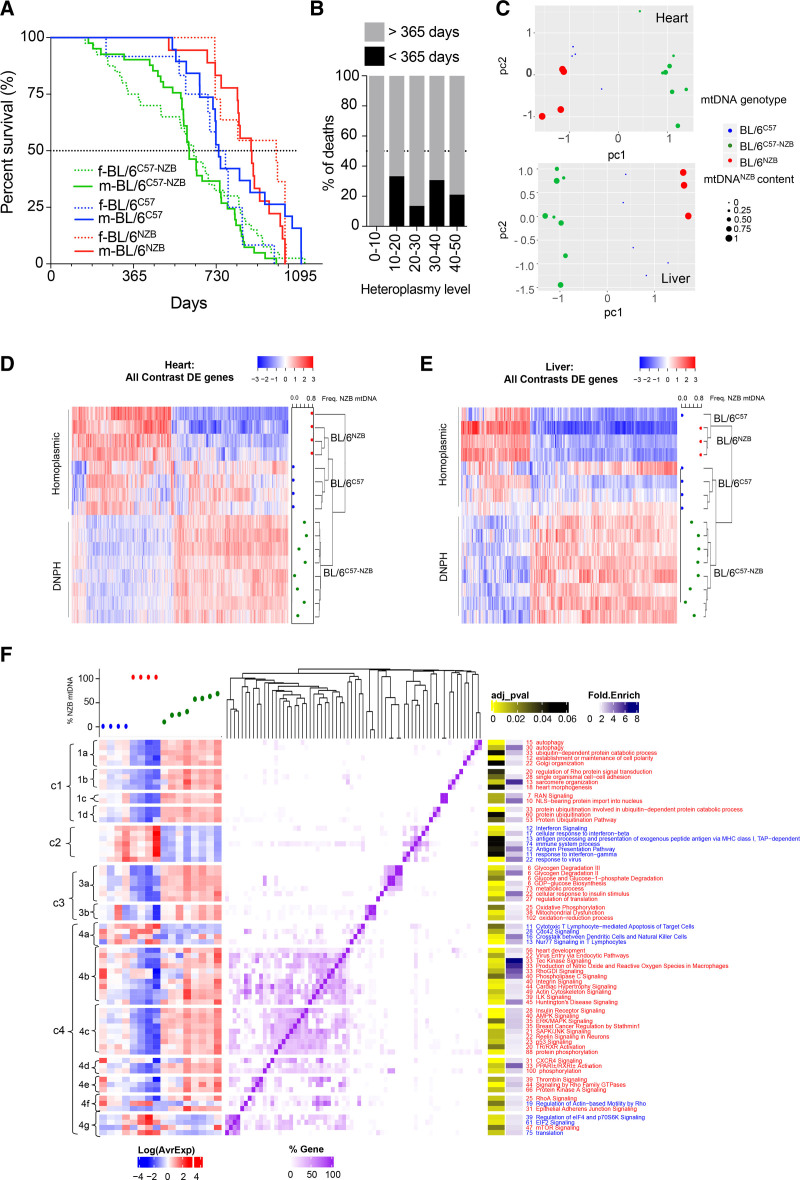
Figure 1.
Mice with divergent nonpathologic mitochondrial DNA heteroplasmy show shortened life span and have a differential transcriptome profile. A, Longevity curves of heteroplasmic and homoplasmic animals separated by sex (female [f], dotted lines; male [m], continuous lines). Data from homoplasmic mice taken from Latorre-Pellicer et al.7 BL/6C57: 19 male, 12 female; BL/6NZB: 18 male, 11 female; BL/6C57-NZB: 41 male, 40 female. ****P<0.0001 for log-rank (Mantel-Cox; χ2=36.85; df=4), Gehan-Breslow-Wilcoxon test. B, Heteroplasmy level at weaning (being 50% of the maximum heteroplasmy level) and frequency of premature death (<365 days) of the animals monitored in A (0%–10%, n=4; 10%–20%, n=9; 20%–30%, n=22; 30%–40%, n=26; 40%–50%, n=19). C, Principal component analysis score plot showing the clustering gene expression of cardiac and liver samples from homoplasmic (n=4) and heteroplasmic (n=8) mice. Each dot corresponds to a different animal and dot size represents the % of NZB mitochondrial DNA (mtDNA) for heteroplasmic mice (green). BL/6C57 transcriptomes are marked in blue and BL/6NZB in red. D and E, Clustered heat maps of the profiles of differentially expressed (DE) heart and liver genes in all contrasts (adjusted P<0.05 for heart samples and adjusted P<0.2 for liver samples). Expression Z scores are shown for each sample on the blue–red scale (see also Tables S1 and S2). The frequency of NZB mtDNA is indicated at the right of each panel. F, Functional analysis of HDE (differentially expressed in the heart) genes between conditions. In the chart, significantly enriched (adjusted P<0.2) Gene Ontology biological processes obtained from the DAVID (Database for Annotation, Visualization and Integrated Discovery) platform and Canonical Pathways from the Ingenuity platform are clustered according to the number of shared genes (purple heat map). Numbers accompanying functional category names indicate the number of HDE genes in each category: blue for downregulated functions/pathways in heteroplasmic versus homoplasmic mice and red for upregulation. The left panel represents the transcriptional profile of the HDE genes present in each category across the different conditions, indicated as % NZB mtDNA content on top of the plot. DNPH indicates divergent nonpathologic heteroplasmy.

