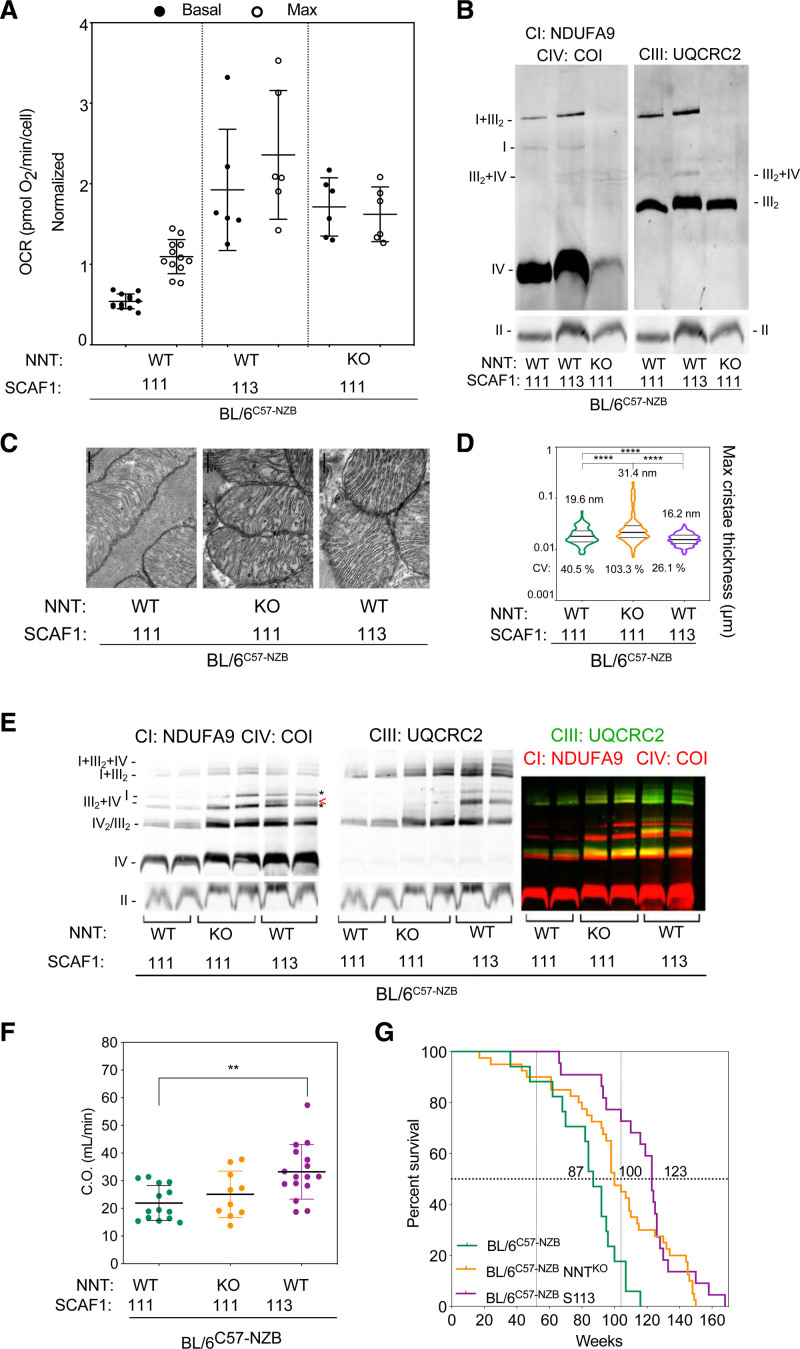
Figure 7.
Effect of the nuclear context on the divergent nonpathologic mitochondrial DNA heteroplasmy phenotype. A, Respiratory performance at high glucose concentration (25 mM) by mouse adult fibroblasts from unmodified heteroplasmic mice (BL/6C57-NZB, containing SCAF1[111] and wild-type NNT [nicotinamide nucleotide transhydrogenase]) and 2 genetically modified strains containing SCAF1(111) and lacking NNT (BL/6C57-NZB:NNTKO) or containing SCAF1(113) and wild-type NNT (BL/6C57-NZB: S113). The chart plot shows basal and maximum oxygen consumption rates (OCRs) measured using Seahorse (5 to 6 independent assays per cell clone). Data are presented as mean±SEM. B, Blue native electrophoresis of digitonin-solubilized mitochondria from the indicated cell clones. Left: complex I (NDUFA9), complex IV (COI). Right: complex III (UQCRC2). Bottom: complex II (FP70). C and D, Transmission electron microscopy analysis of cardiac mitochondrial ultrastructure and cristae thickness. Images in (C) are representative of the indicated clones and the chart (D) shows quantification of 409 BL/6C57-NZB cristae, 268 BL/6C57-NZB:NNTKO cristae, and 288 BL/6C57-NZB:S113 cristae. Violin plot shows the frequency distribution of the data; lines represent median and quartiles. ****P<0.0001 (nonparametric Kruskal-Wallis test). E, Blue native electrophoresis of digitonin-solubilized cardiac mitochondria from 12-week-old mice of the indicated strains. Left: complex I (NDUFA9), complex IV (COI). Asterisks indicate the position where CIV migrates without CIII and the arrowhead the position of SC III2+IV. Middle: complex III (UQCRC2). Right: merged immunodetection of the indicated proteins (green, CIII; red, CI and CIV). Bottom: complex II (FP70). F, Cardiac output echocardiography analysis in 74-week-old male mice of the indicated genotype. Each dot represents an individual mouse. **P<0.01 (t test, BL/6C57-NZB:S113 or BL/6C57-NZB:NNTKO versus control heteroplasmic mice: BL/6C57-NZB, n=14; BL/6C57-NZB:S113, n=16; and BL/6C57-NZB:NNTKO, n=10). G, Survival curves of the heteroplasmic strains. For the comparison of BL/6C57-NZB and BL/6C57-NZB:S113 mice, ****P<0.0001 by log-rank test (Mantel-Cox; χ2=22.29; df=1) and ****P<0.0001 by Gehan-Breslow-Wilcoxon test. For the comparison of BL/6C57-NZB and BL/6C57-NZB:NNTKO, **P<0.01 by log-rank test (Mantel-Cox; χ2=9.322; df=1) and *P<0.05 by Gehan-Breslow-Wilcoxon test. BL/6C57-NZB mice (results taken from Figure 1A): BL/6C57-NZB:NNTKO mice, 22 male and 18 female; and BL/6C57-NZB:S113 mice, 13 male and 9 female. SCAF indicates supercomplex assembly factor 1.

