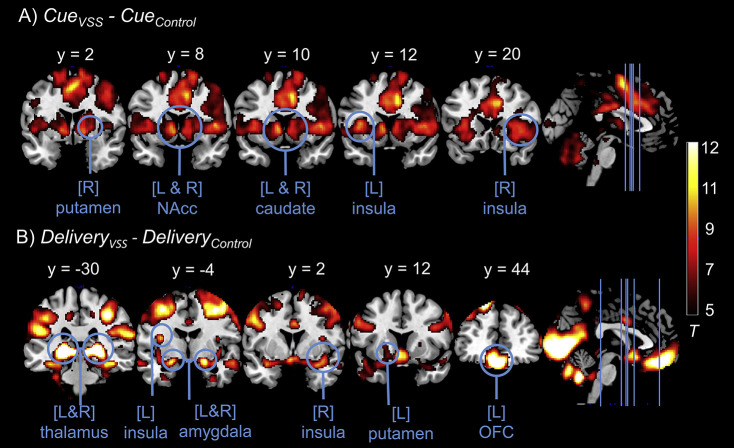
Fig. 3.
ROI activity for the contrasts CueVSS–CueControl (A) and DeliveryVSS–DeliveryControl (B). Lines on the sagittal slice on the right side indicate the coronal slices depicted on the left. Cues signaling VSS (CueVSS) as compared to cues signaling massage clips (CueControl) elicited a higher BOLD response in putamen, NAcc, caudate, and insula. VSS clips (DeliveryVSS) compared to massage clips (DeliveryControl) elicited a higher BOLD response in thalamus, insula, amygdala, putamen, and OFC. Displayed t-values are thresholded at t < 5

