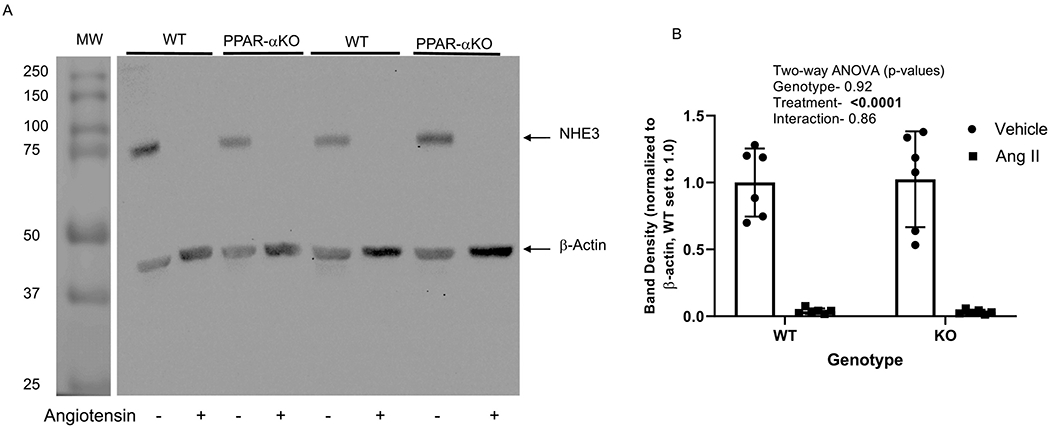
Figure 4. Effect of angiotensin II on NHE3 expression in WT and PPAR-α KO mice:

A. Representative western blot of NHE3 and β-actin (normalizer) of membrane-enriched kidney cortex samples from WT and PPARα KO mice treated as vehicle (−) or with angiotensin II (+) infusion by osmotic minipump for 12 days. Gel was loaded with an equivalent amount of protein from each mouse kidney. B, summary of western blotting densitometry (mean ± sem, n = 6/group); results of two-way ANOVA (genotype X treatment) displayed in graph inset. Significant effect (p < 0.05) shown in bold font.
