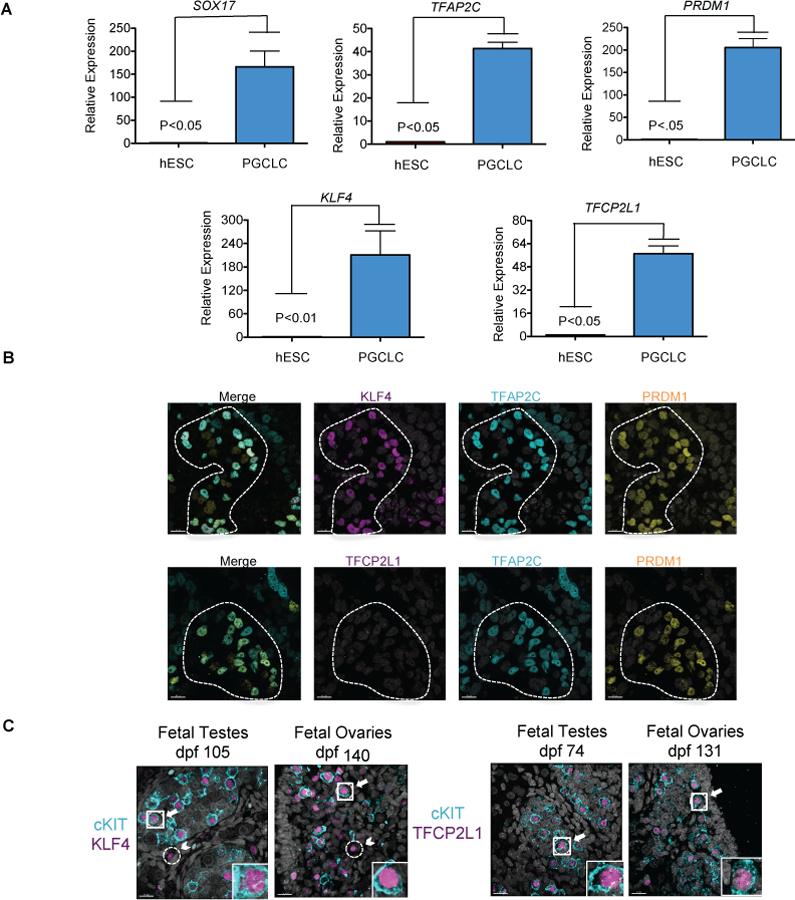
Figure 1. KLF4 and TFCP2L1 are dynamically expressed during hPGCLC specification.

a. Quantitative real-time rt-PCR of KLF4 and TFCP2L1 in hESCs, and hPGCLCs from the UCLA1 hESC line at day 4 (D4) of differentiation. n=3 independent replicates of hESC and hPGCLCs. T-test was used to determine significance between these two groups. b. Representative immunofluorescence for KLF4 and TFCP2L1 in TFAP2C/PRDM1 double positive hPGCLCs at D4 (n= 8 aggregates of UCLA8). Scale bars show 15 microns. c. Representative immunofluorescence images of prenatal gonads (n=6) and testes (n=6) at indicated days post fertilization (dpf): Arrows highlight double positive hPGCs, Arrow head indicates single positive somatic cells
