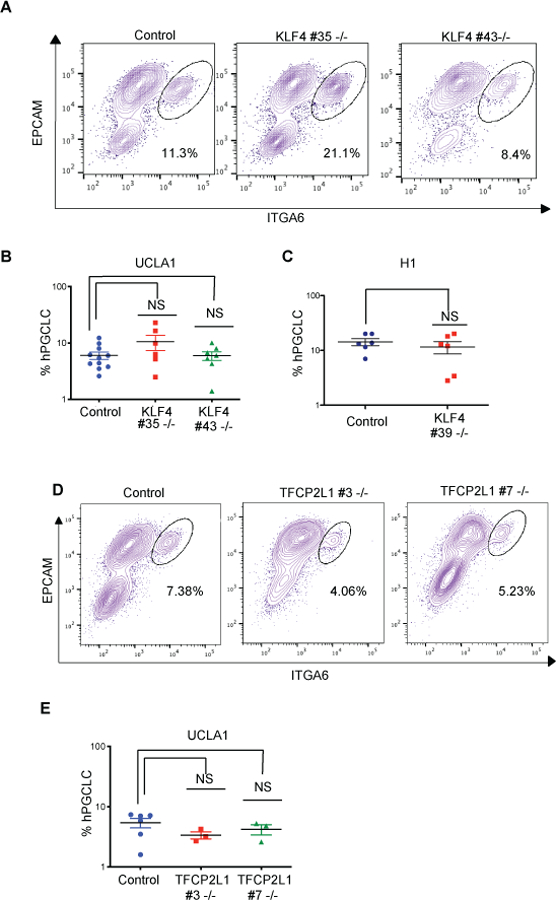
Figure 3. KLF4 and TFCP2L1 are not involved in hPGCLC induction from hESCs.

a. Representative FACS plots showing EPCAM/ITGA6 double-positive hPGCLCs in control and KLF4 mutant aggregates at D4. b. Quantification of the percentage ITGA6/EPCAM hPGCLCs in control (n= 12 biological replicates) and KLF4 UCLA1 mutant sublines (n=6 and n=7 biological replicates respectively). c. Quantification of the percentage ITGA6/EPCAM hPGCLCs in control (n= 6 biological replicates) and KLF4 H1 mutant subline (n=6 biological replicates). d. Representative FACS plots showing EPCAM/ITGA6 double-positive hPGCLCs in TFCP2L1 control and mutant aggregates at D4. e. Quantification of the percentage ITGA6/EPCAM hPGCLCs in control (n= 8 biological replicates) and TFCP2L1 UCLA1 mutant sublines (n=3 and n=3 biological replicates respectively).
