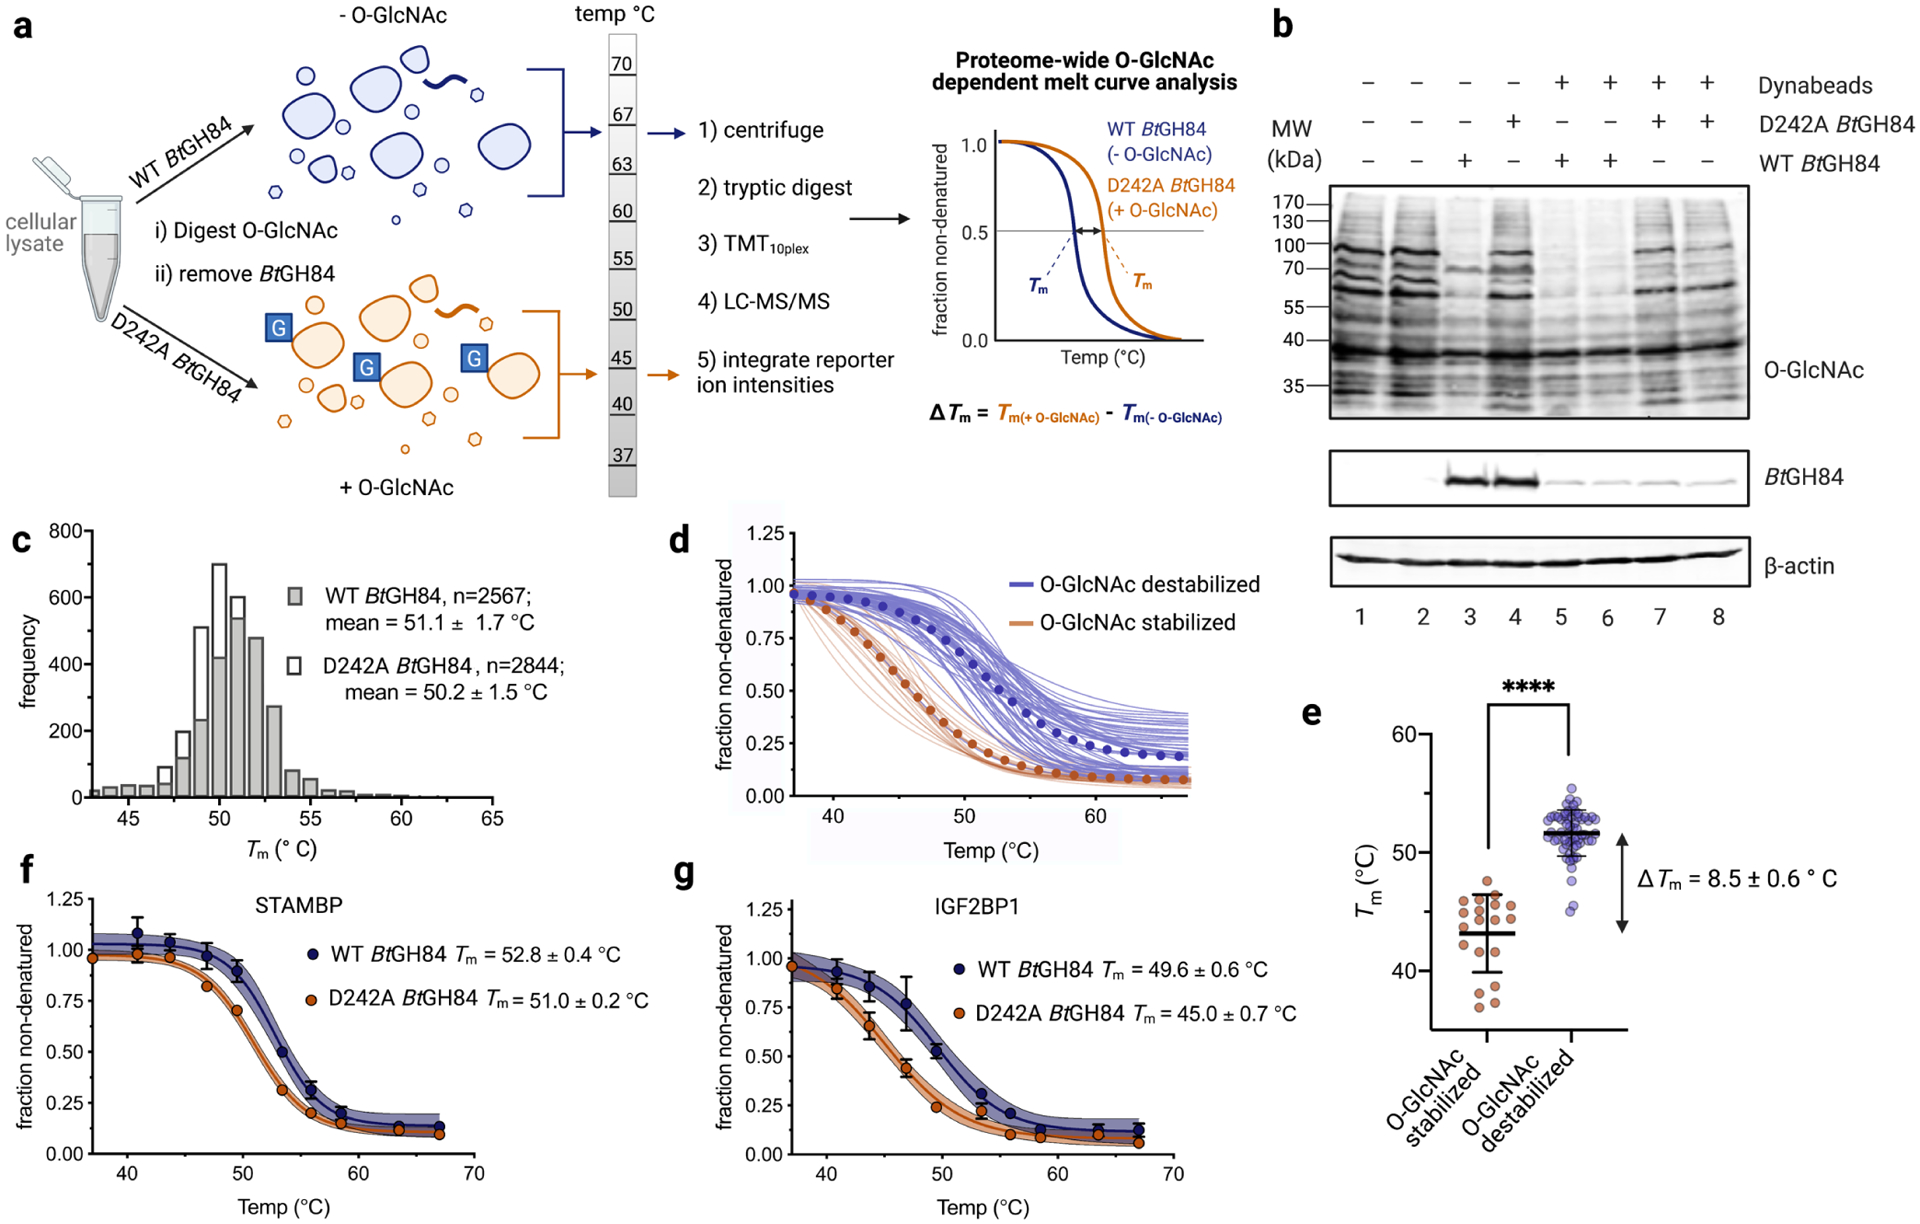
Figure 2. erPTM-TPP enables global identification of proteins having O-GlcNAc-dependant thermostability.

a, Schematic outlining the erPTM-TPP method. b, Immunoblot following treatment of cellular lysates with WT or D242A BtGH84. c, Histogram of Tm values for all proteins that could be curve-fit in the WT and D242A BtGH84 treated samples. d, Overlay of melt curves for O-GlcNAc stabilized and O-GlcNAc destabilized proteins. Curves for both WT and D242A BtGH84 conditions are shown. e, Scatter plot comparing Tm values for O-GlcNAc stabilized and destabilized proteins from d, with P values: two tailed student’s t-test assuming unequal variance; ****P < 0.0001. f-g, Melt curves for select proteins comparing WT and D242A BtGH84 conditions. Error bars correspond to SE from four experimental replicates. See also Figures S1–S4, and Tables S1–S2.
