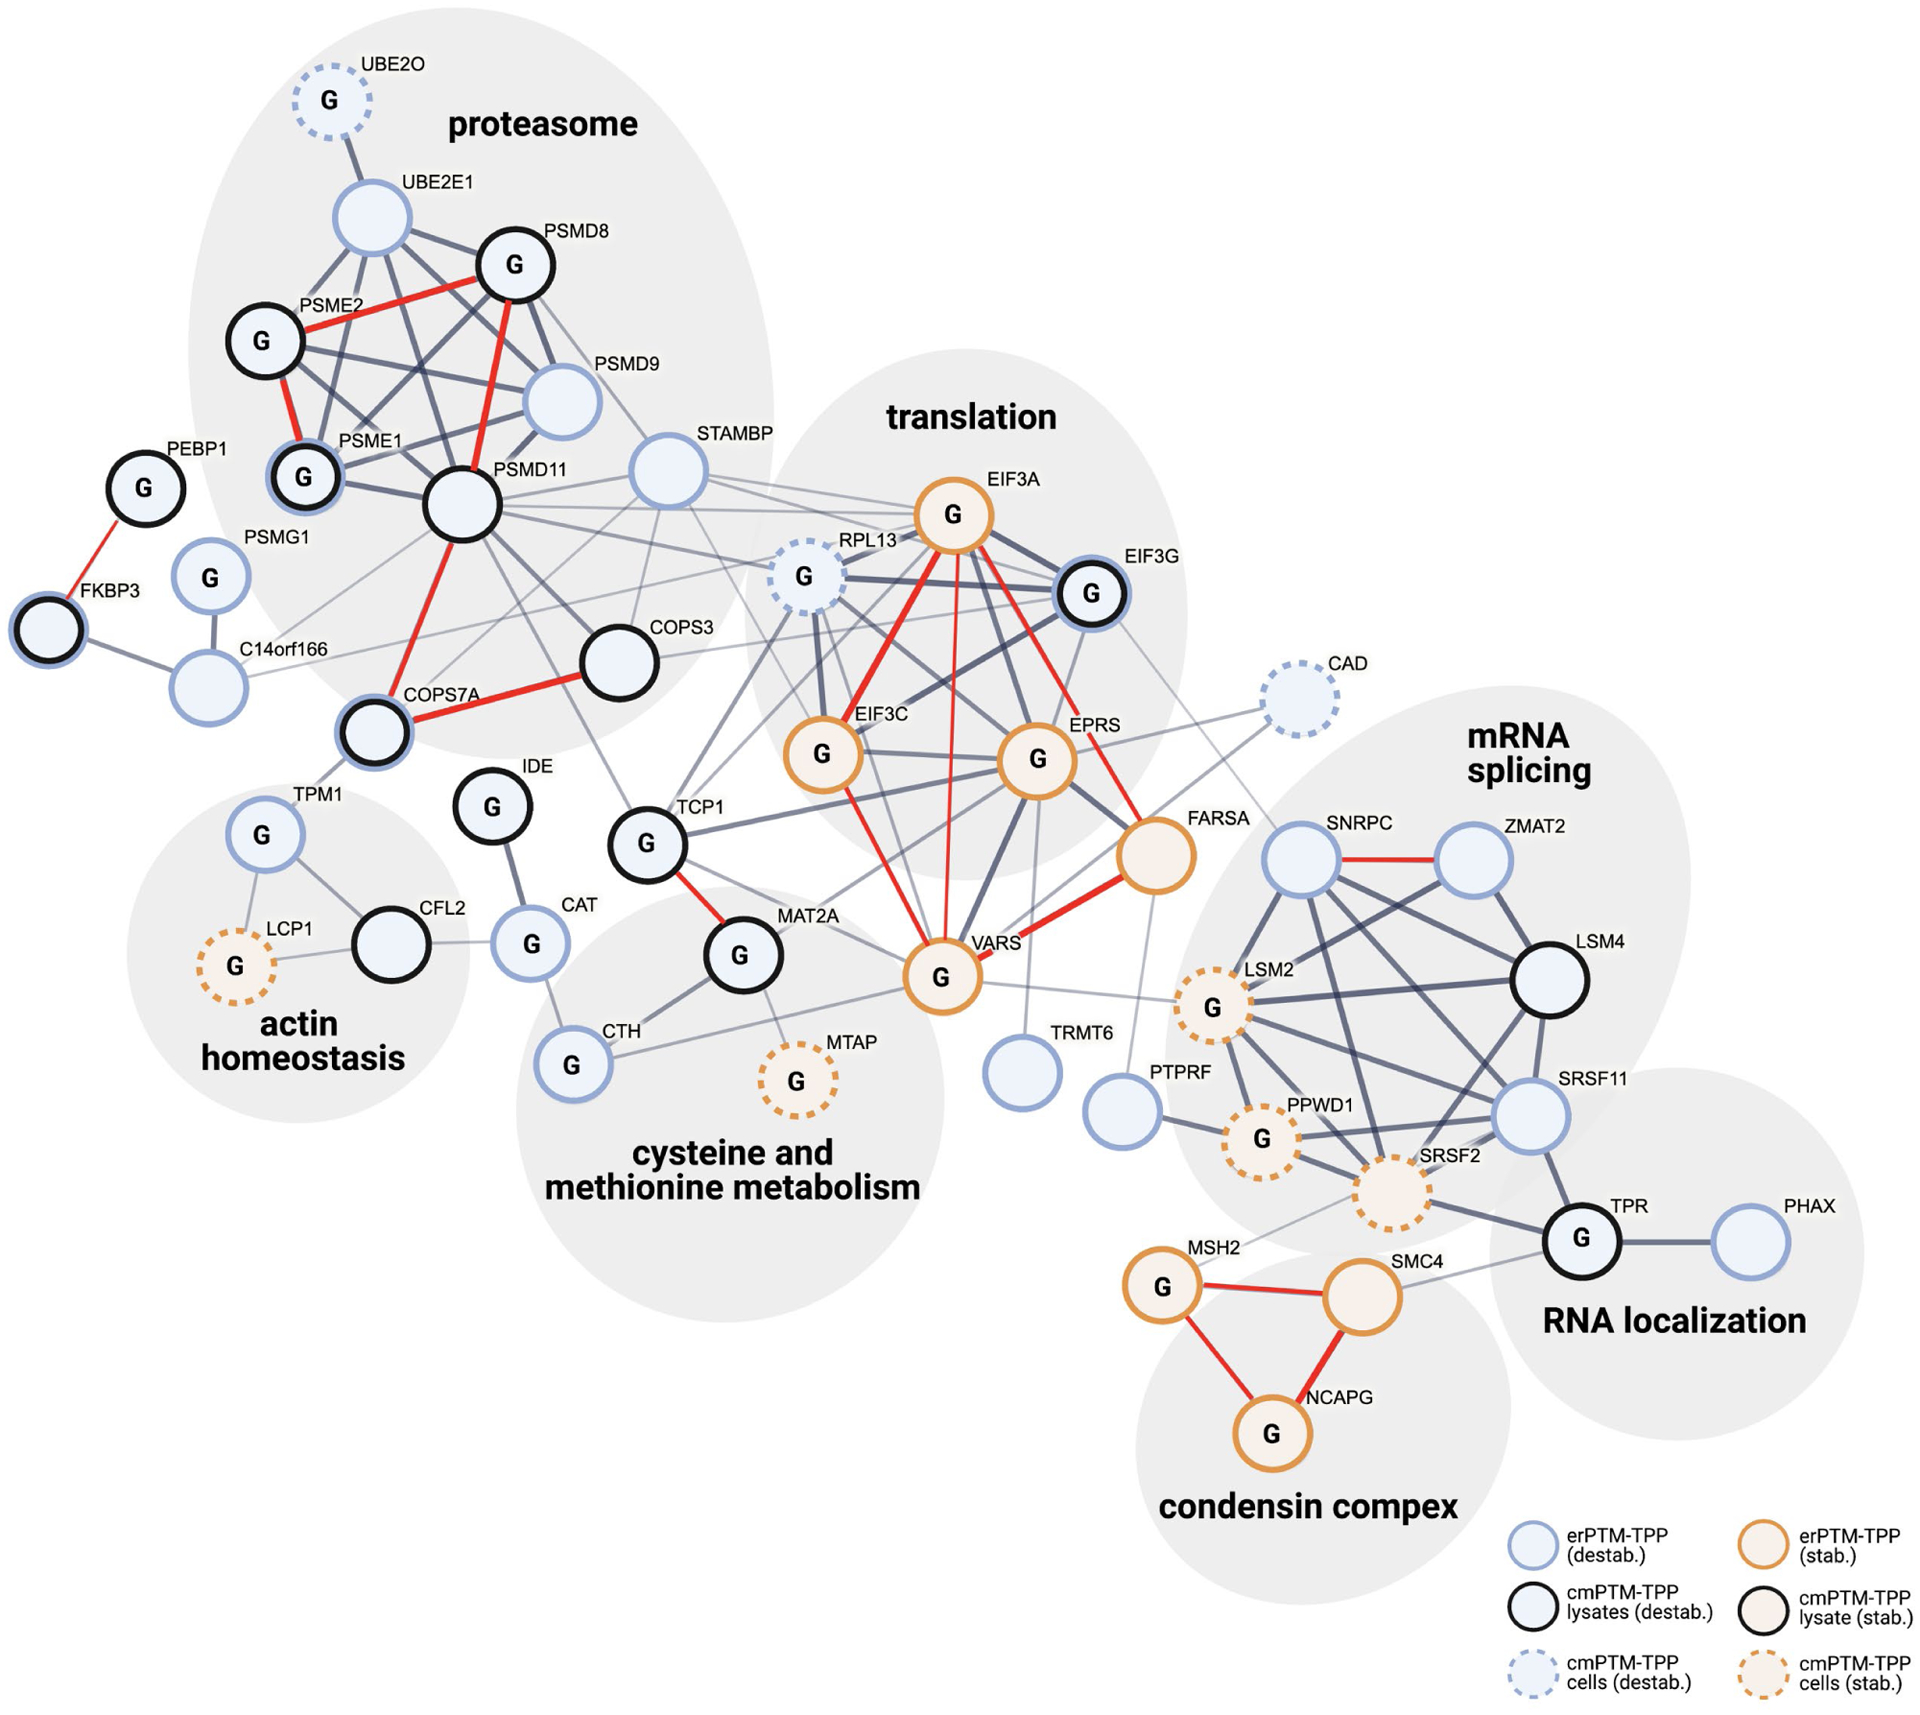
Figure 4. Proteins displaying O-GlcNAc dependant thermostability cluster into distinct protein complexes.

STRING protein interaction network of proteins displaying O-GlcNAc dependant thermostability. Nodes represent individual proteins coded by stability difference and PTM-TPP method(s). The network was constructed using the STRINGv11 server57. Line thickness connecting nodes reflects the interaction score as outlined in methods, and proteins are grouped into cellular components (gene ontology, false discovery rate < 0.001). Proteins displaying evidence for direct interaction in TPCA analysis (P < 0.1) have a red line connecting nodes (see methods). Known O-GlcNAcylated proteins are labelled (G).
