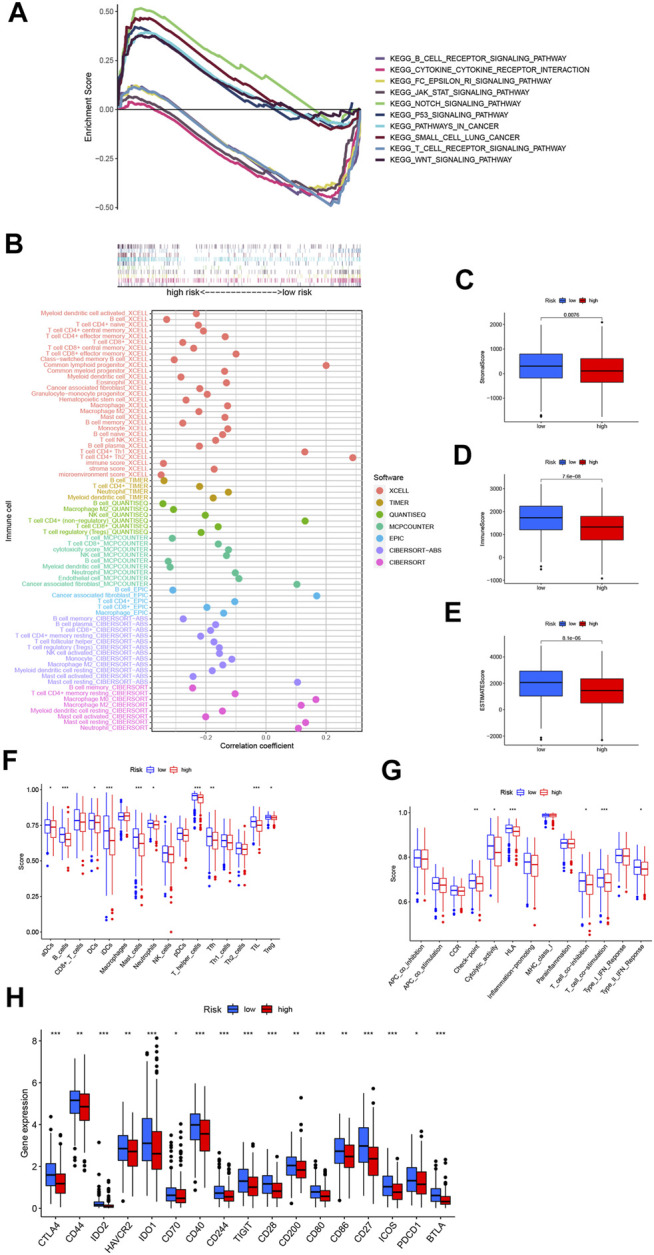
FIGURE 6.

The differences of tumor immune microenvironment between the low- and high-risk groups. (A) Gene set enrichment analysis of the top 10 pathways significantly enriched in the risk groups. (B) The immune cell bubble of risk groups. (C–E) The box plots of the comparison of StromalScore, ImmuneScore, and ESTIMATEScore, respectively, between low- and high-risk groups. (F, G) The ssGSEA scores of immune cells and immune functions in the risk groups. (H) The difference of common immune checkpoint expression in the risk groups. *p < 0.05, **p < 0.01, ***p < 0.001.
