
Figure 2.
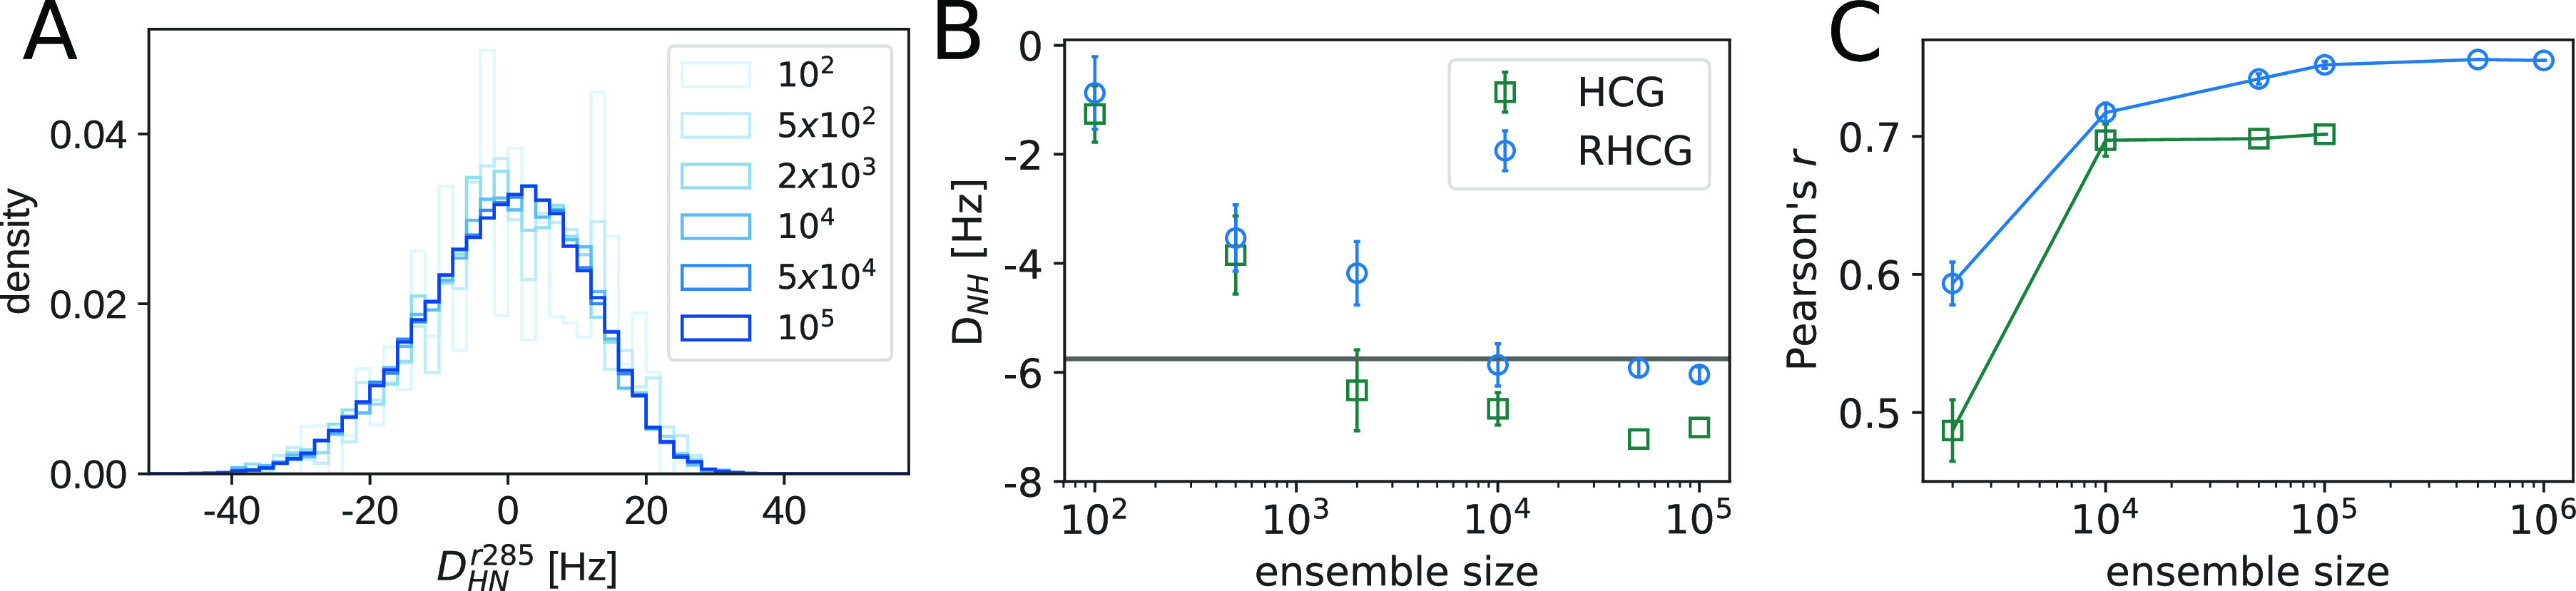
Large ensembles are required to capture NMR RDC measurements. (A) Distribution of 1H–15N RDC values for L285 in RHCG ensembles of different size, as calculated by PALES66 without rescaling. (B) Average 1H–15N RDC for L285 in dependence of the ensemble size for HCG (dark green squares) and RHCG (blue circles). Error bars indicate ± SEM. (C) Ensemble-size dependence of Pearson r correlation coefficient between tau K18 1H–15N RDC measurements27 and calculations from RHCG (blue circles) and HCG (green squares), respectively.