Figure 4.
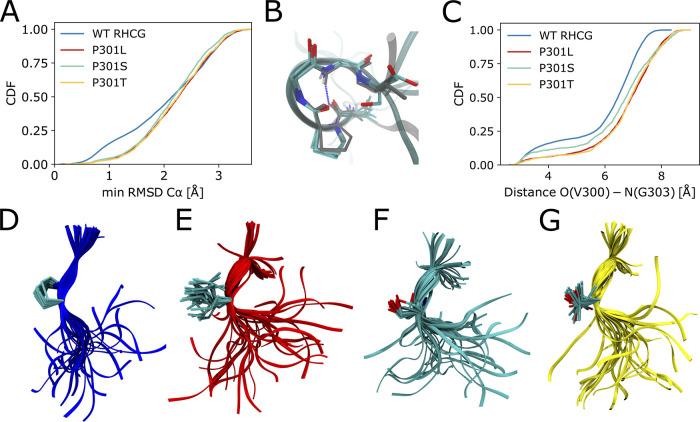
Tau P301 mutations favor more extended local structures. (A) Cumulative distributions of the minimum Cα RMSD of 300VPGGG304 to the closest representative of the NMR ensemble of microtubule-bound structures.57 Results are shown for the RHCG ensembles of WT tau K18 and for the HCG ensemble of the P301L, P301S, and P301T variants. (B) Five representative structures of 300VPGGG304 from RHCG (oxygen: red; nitrogen: blue; carbon: cyan; Cα RMSD < 0.5 Å) are superimposed on a representative of the NMR structural ensemble (gray sticks, PDB: 2MZ7, structure 17). Tubes indicate the amino acid backbone. The O(300)–N(303) hydrogen bond is indicated by the blue dashed line. (C) Cumulative distributions of O(V300)–N(G303) distances for WT tau K18 from RHCG compared to P301L, P301S, and P301T tau K18 variants from HCG. (D) Representative local structures of WT tau K18. (E) Representative local structures of the P301L variant. (F) Local structures of P301S. (G) Local structures of P301T. In (D)–(G), the structures were aligned on residues 300 and 301. Tubes indicate the backbone. Side-chain heavy atoms, amide nitrogen, and Cα of residue 301 are shown as sticks (oxygen: red; nitrogen: blue; carbon: cyan).

