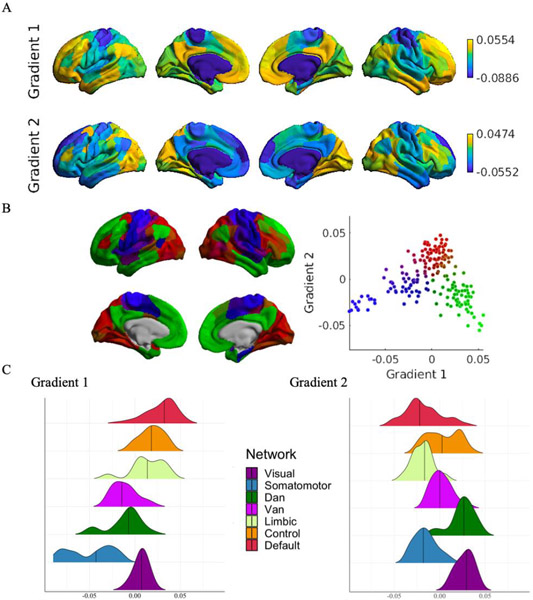
Figure 6. Gradient mapping of CoVA patterns.
Gradient mapping was implemented on our unpermuted node-wise group-level CoVAcor matrix using the diffusion map embedding algorithm. (A) Results for the first two gradients. The first gradient separated sensory, motor and attentional regions from higher-order cognitive nodes. The second gradient separated visual and dorsal attention network nodes from nodes belonging to the somatomotor, limbic and default networks. (B) Embedded space for the first two gradients. Each point is a node of the transformed matrix. Nodes showing high functional association between rsFC and irsMSSD are closer together in the embedded space, whereas nodes with low CoVA are farther apart (Visual: red; Somatomotor: blue; DAN: brown; VAN: purple; Control: dark green; Default: light green). (C) Ridge plots depicting the network-wise distribution of values for the two gradients.

