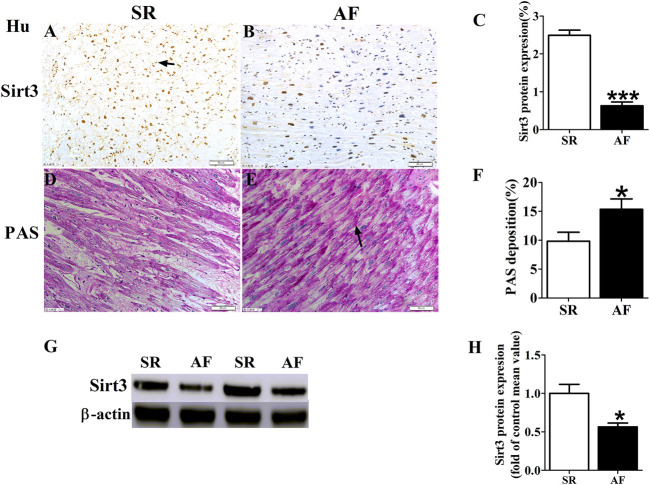
FIGURE 1.
Changes of Sirt3 and glycogen in AF patients. (A,B and C) Representative images and statistical results for protein expression of Sirt3 in the atria of patients. (D,E and F) Representative images and statistical results for the accumulation of glycogen in both groups of patients. (G and H) Representative bands and statistical analyzing for protein expression of Sirt3 in patiets. The magnification is ×20. * p < 0.05 vs. SR group, Data from these proteins were normalized to β-actin, n = 6 each group.

