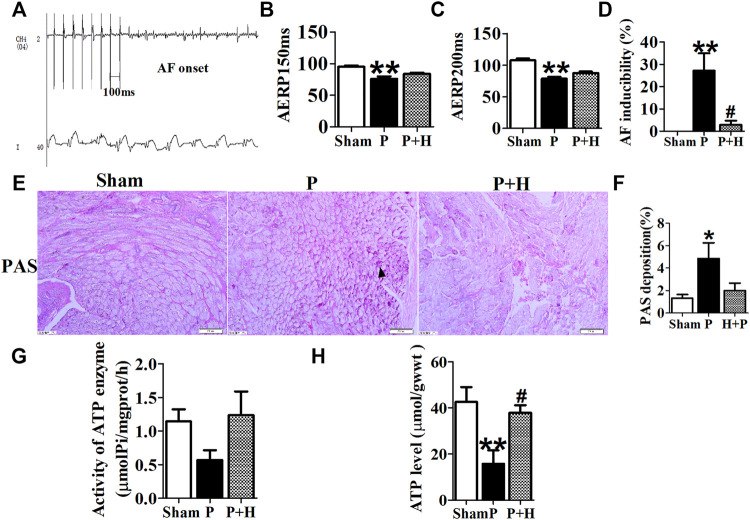
FIGURE 2.
Electrophysiology detection and assay of glycogen and ATP. (A) AF was induced after rapid-pacing. (B,C) AERP150 ms and AERP200 ms, (D) AF inducibility. n = 6 each group. (E and F) Representative images and statistical results of the glycogen accumulation in the atria of rabbits, the magnification is ×20. (G and H) Statistical analyzes of activity in ATP enzyme and level of ATP. *p < 0.05 vs. sham group,**p < 0.01 vs. sham group, #p < 0.05 vs. P group, n = 6 each group.

