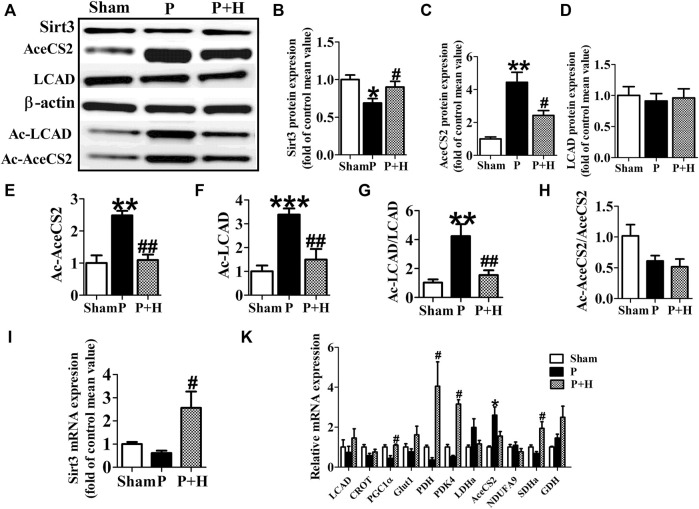
FIGURE 3.
HL inhibited the remodelling of metabolic factors and acetylation level of key metabolic enzyme in rabbit of AF model. (A) Representative bands of protein expression of Sirt3, AceCS2, Ac-LACD and Ac-AceCS2. (B,C,D,E,F) Quantification analyzing of protein expression of Sirt3, AceCS2, Ac-LACD and Ac-AceCS2. (G and H) Statistical results for ratio of Ac-LCAD/LCAD and Ac-AceCS2/AceCS2. (I) Statistical results for expression of Sirt3 gene.(K) Statistical results for expression of LCAD, CROT, PGC1α,PDH,PDK4, LDHa, AceCS2, NDUFA9, SDHa and GDH genes. Data from these proteins were normalized to β-actin, and genes were normalized to β-actin. *p < 0.05 vs. sham group, **p < 0.01 vs. sham group, ***p < 0.001 vs. sham group; #p < 0.05 vs. P group, ##p < 0.01 vs. P group, n = 6 each group.

