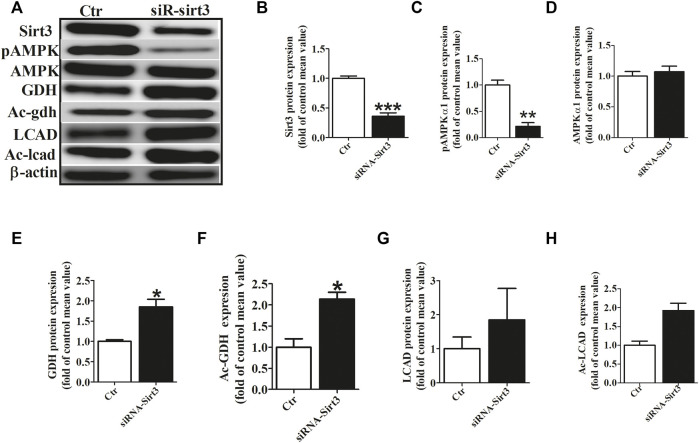
FIGURE 5.
Sirt3 siRNA up-regulated the acetylation level of metabolic enzymes. (A) Representative bands of Sirt3, pho-AMPKα1, AMPKα1, GDH, Ac-GDH (Ac-gdh), LCAD and Ac-LCAD expression. (B) Statistical results for Sirt3 expression. (C,D) Statistical results for pho-AMPKα1and AMPKα1 expression. (E,F) Statistical results for GDH and Ac-GDH expression. (G,H) Statistical results for LCAD and Ac-LCAD expression. *p < 0.05 vs. control group, **p < 0.05 vs. control group, ***p < 0.05 vs. control group, n = 3 each group.

