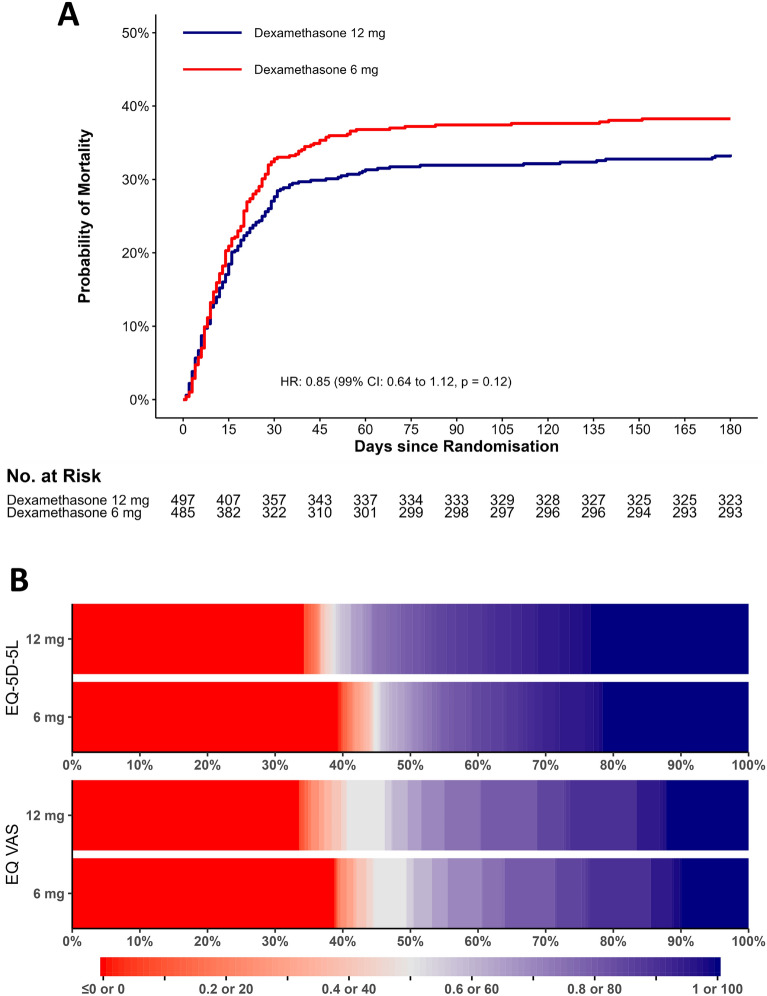
Fig. 2.
Time to death or censoring and distribution of HRQoL data at 180 days in the two intervention groups. A Mortality curves in the two intervention groups up to 180 days. Patients who withdrew consent for further data registration or were lost to follow-up were censored at the time of the withdrawal or loss to follow-up. The time to death was compared post hoc using Cox regression with results presented as an unadjusted hazard ratio (HR) with 99% confidence interval (CI) and P value. B Distribution of the HRQoL data as horizontally stacked proportions in the two intervention groups. Patients who died within 180 days after randomisation were assigned the value 0, corresponding to a health state equal to being dead for EQ-5D-5L index values and the worst possible value for EQ VAS. Data from non-respondents were multiply imputed (n = 60 for the index values and n = 58 for EQ VAS scores). Red represents worse outcomes, and blue represents better outcomes. For EQ-5D-5L index values, < 1% of the values in each group in the imputed datasets were below 0, corresponding to health states worse than being dead. These values are displayed together with the value zero

