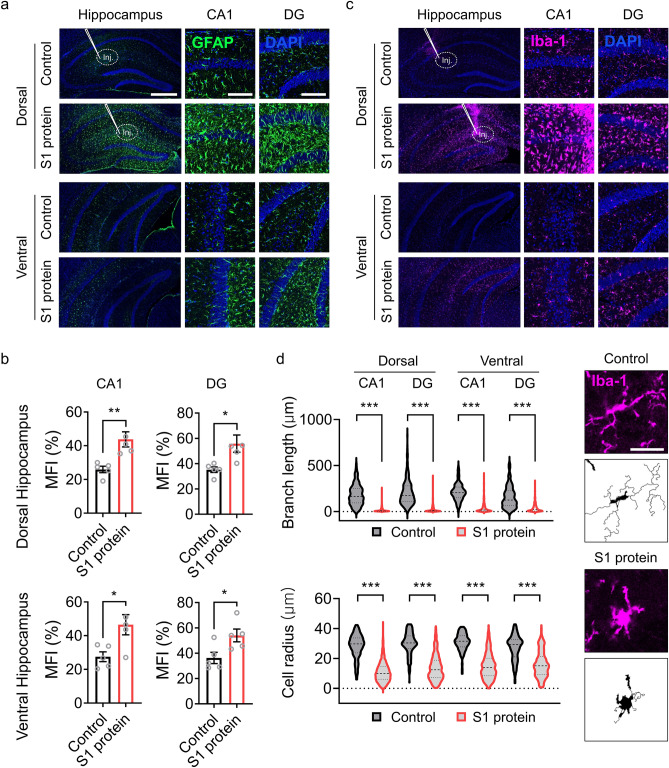
Figure 3.
S1 protein induces astrocyte and microglia activation in the hippocampus. (a, c) Representative images of immunohistochemistry with GFAP and Iba-1 antibodies show activation of astrocytes (GFAP+, green) and microglia (Iba-1+, purple) after stereotaxic S1 protein administration (n = 5, scale bar = 500 for left and 250 µm for middle and right). (b) Mean fluorescence intensity (MFI) of GFAP+ signal measured in CA1 and DG regions of dorsal hippocampus (upper) and ventral hippocampus (bottom). (d) Microglia activation was characterized by morphological parameters such as total branch length (upper left) and radius of cell area (bottom left). Representative pictures of microglia in the saline (Control)- or S1 protein-injected mice (right, scale bar = 25 µm). Data are presented as the `mean ± s.e.m. Statistical results are for unpaired t-tests. *** p < 0.001.

