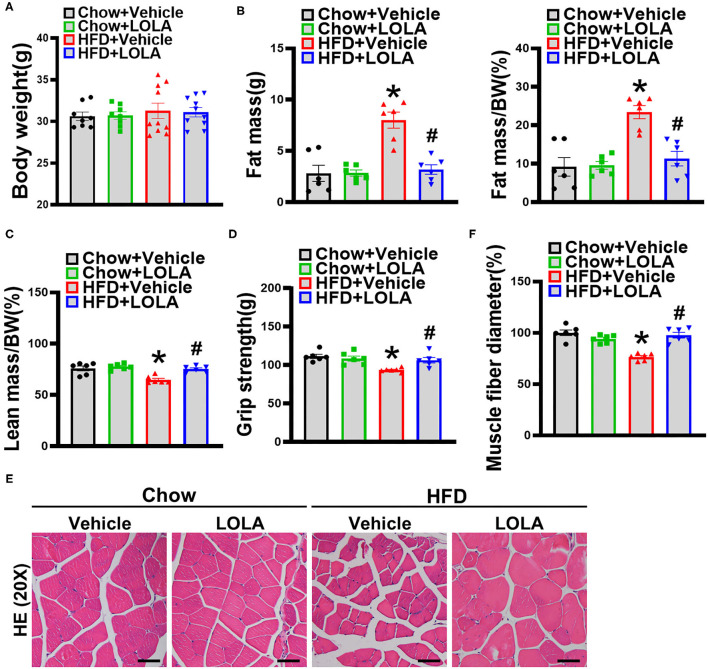
Figure 7.
LOLA improved sarcopenic obesity in mice fed with an HFD. (A) Body weight of mice after LOLA intervention are measured (n = 8–10). (B) Fat mass, fat mass/bodyweight (BW), (C) lean mass/BW are detected by NMR (n = 6). (D) Forelimb grip strength is tested (n = 6). (E) Representative hematoxylin and eosin staining pictures of quadriceps in mice (n = 6) are shown (scale bar, 50 μm). (F) Mean diameters of muscle fibers are quantified (n = 6). The data are presented as the mean ± SEM, unpaired two-tailed Student's t-test. *P < 0.05, vs. mice fed with chow diet; #P < 0.05, vs. mice fed with HFD.

