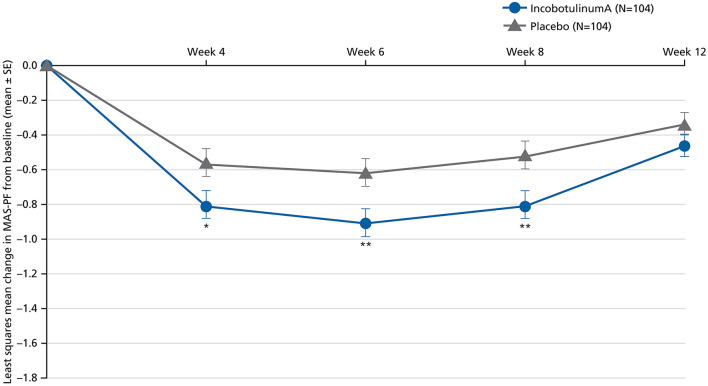
Figure 3.
Least squares mean change in MAS-PF from baseline to Weeks 4, 6, 8, and 12 in the MP (BOCF, FAS; ANCOVA). ANCOVA, analysis of covariance; BOCF, baseline observation carried forward; FAS, full analysis set; MAS-PF, Modified Ashworth Scale spasticity score for the plantar flexors, MP, main period; SE, standard error. *p < 0.05. **p < 0.01 (vs. placebo). Error bars represent the SE.

