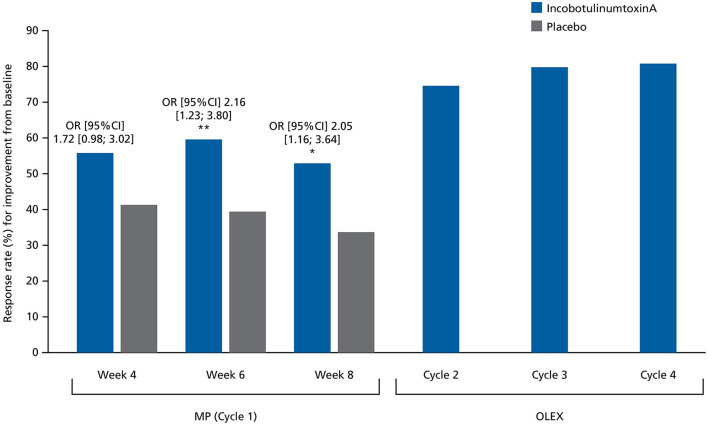
Figure 4.
Response rates (%) for at least 1-point improvement from baseline in MAS-PF at Weeks 4, 6, and 8 in the MP and at the Week 4 assessment visit during Cycles 2, 3, and 4 in the OLEX (worst-case approach, FAS). Comparisons between treatment groups were performed using a logistic regression model where response to treatment was the dependent variable, baseline MAS-PF score was a covariate, and site (pooled), treatment and sex were factors. CI, confidence interval; FAS, full analysis set; MAS-PF, Modified Ashworth Scale spasticity score for the plantar flexors; MP, main period; OLEX, open-label extension period; OR, odds ratio. *p < 0.05. **p < 0.01.

